What vapor sorption can and can’t tell you
Moisture content and water activity. Each has its assigned roles and responsibilities. They’re often used separately, and for very different purposes. But can they work together?

In this live webinar, our AQUALAB experts will break down how and why mapping moisture content and water activity together – and how they change over time – can open a new world of valuable information.
You’ll learn:
- Why MC and aW combined can tell you more than they would separately
- All the ways to create isotherms, plus the strengths and weaknesses of each method
- How to interpret and use your moisture sorption isotherms
- Why isotherms can predict texture changes so precisely
- Why shelf life and packaging decisions can be made faster using isotherms
- How to extract business value from your isotherms – both in and out of the R&D department
Presenters
Mary Galloway is a lead scientist in the AQUALAB Research & Development lab. She specializes in using and testing instruments that measure water activity and its influence on physical properties. She has worked with many customers to solve moisture-related product issues.
Zachary Cartwright is a lead food scientist at AQUALAB. He helps customers achieve complete moisture analysis of their products and is an expert in the use of the Vapor Sorption Analyzer (VSA). He has a PhD in food science from Washington State University and a bachelor’s degree in biochemistry from New Mexico State University.

Transcript, edited for clarity
Brad Newbold (Webinar Host): Hello everyone, and welcome to Understanding Isotherms: What Vapor Sorption Can and Can't Tellcal You. Today's presentation will be about 30 minutes—it's going to be a jam-packed 30 minutes, I can guarantee that—followed by a Q&A session with Dr. Zachary Cartwright and Mary Galloway, food scientist and application scientist respectively here at AQUALAB. So without any more ado, I will hand the microphone to Zachary to get us started.
Dr. Zachary Cartwright: Hi, everyone. Thank you so much for joining today. Really happy to be here with Mary. Like Brad said, we are here to talk about isotherms and what vapor sorption can and can't tell you. Again, my name is Zachary Cartwright and I'm sitting here with Mary Galloway.
Mary Galloway: Good morning!
What we’ll cover today
ZC: Let's get started. This first slide is an outline. I just want to show you the direction that we're headed today. We're going to start off by talking about moisture content and water activities separately, and then show you how we can know more once we combine these two measurements together.
Then we're going to move through all of the different ways you can create isotherms, talking about some traditional and classic methods, as well as DVS and then DDI methods.
Once we know what an isotherm is and how we can create it, we'll be talking about how to interpret them and use them primarily in the food industry, but this can also be used in the pharma industry, as well as building materials or even for soil science. So we'll be looking at predicting texture change and also making shelf life predictions as well as packaging decisions.
Then at the end of this presentation, we'll be talking about extracting business value from isotherms – we’ll go over a few narratives from different companies using isotherms and talk about some of the business value they've been able to get from them.
We're going to do our best to stick to our 30 minutes. We have a lot to share today, and I'm sure we'll go over. I hope you stick with us throughout the entirety of the presentation. Now I'll hand it over to Mary, she's going to talk about water activity and moisture content.
Isotherm ingredients: Moisture content and water activity
MG: All right. When we're talking about moisture measurements, mostly we're talking about two main things.
The first one is moisture content – the quantitative amount of water, the amount of water in something. This is important for maximizing yield and revenue, because if you can increase your moisture content, water is cheap and you can increase your yield and your revenue. But it doesn't give you a full picture of what's happening, because it is not a process driver, meaning that if we have moisture migration or other issues, moisture content is not going to be able to tell you what you need to know.
What you do need to know is water activity. This is a measure of the energy status of the water, and that is what drives processes to happen – microbial growth, moisture migration, that kind of thing.
It's really important for product safety and quality. There are water activity limits, especially in the food code where you have to stay under a specific water activity limit so your product is safe from microbial growth and things like that. It’s also a good indicator of quality.
So if we take these two measurements, what we're really doing is we're finding a target value that the manufacturer is trying to achieve. If you're measuring moisture content and water activity, you already have figured out where you want this to be. Then you're just trying to hit that target.
Those targets are usually going to come from regulatory compliance or production specification. An example of a regulatory compliance target would be microbial growth limits. So 0.7 here is for mold, 0.85 for potentially hazardous food microbes.
The other one is for production specification. But how are these targets determined? If we are just measuring water activity and moisture content, and we plot them together on a graph, we're going to get this one data point. We know there’s a relationship between water activity and moisture content, but this isn’t the whole picture.

This is just one data point out of a whole moisture map. Here we're showing one data point represented on the isotherm. You can see that it spans a whole range of water activity, that’s going to influence what is happening or what can happen to your sample.

Here’s a whole isotherm. It's really important to know where on that curve your product sits. If it’s getting really close to mold growth levels or maybe hitting a high zone for those browning reactions, we need to know where that is so you can avoid them.

Another way to think of this is instead to think of safety and quality on this X axis instead of water activity. And instead of moisture content, you can think of that as yield and revenue. So if we can find the sweet spot where your product needs to be, then you can maximize both of these measurements.
Now, Zachary's going to talk about the classic ways to create vapor sorption isotherms.
Using desiccators or environmental chambers to create vapor sorption isotherms
ZC: The first way, or the traditional way, to create an isotherm is using a series of desiccators or environmental chambers. This is a methodology that I see a lot of graduate students using, but I'm also surprised at the number of companies—even big companies—that continue to use this method.
The way this works is that you have to determine your equilibrium moisture content at several different water activities or several different relative humidities. So you might use six to nine controlled humidity chambers. It's really important to keep these at a constant temperature.
Then what you're going to do is measure the weight change until you've reachedequilibrium. So you put your sample in one of these chambers and then every day or so you have to take that sample out, take a weight reading, and then put it back. You’ll then have to do this over and over until you reach a constant weight.
As you can imagine, this is very slow, requires a lot of labor, and usually you only get a few data points.

Here's an example of the data that you might collect from using this method. You'll notice the data points there in red for water activity versus moisture content. You'll notice that it is really hard to fit any type of model to this data. This is because there's lots of room for error using this methodology.
Creating vapor sorption isotherms with the dynamic vapor sorption method
There's a newer method, called the DVS or the dynamic vapor sorption method. This was developed in the early 90s by Pfizer to look at drugs and excipients and to understand their sorption properties.
This method is similar to that previous slide, where we hold our sample in a closed chamber and we're still waiting for equilibrium to be achieved. The difference here is that this is an automated system, so it will automatically cycle through new humidity environments depending on the settings that you set up.
This is good because it's faster and you can get more data points. It’s really good for evaluating things like sorption kinetics, or if you're checking a time dependent physical change like crystallization.
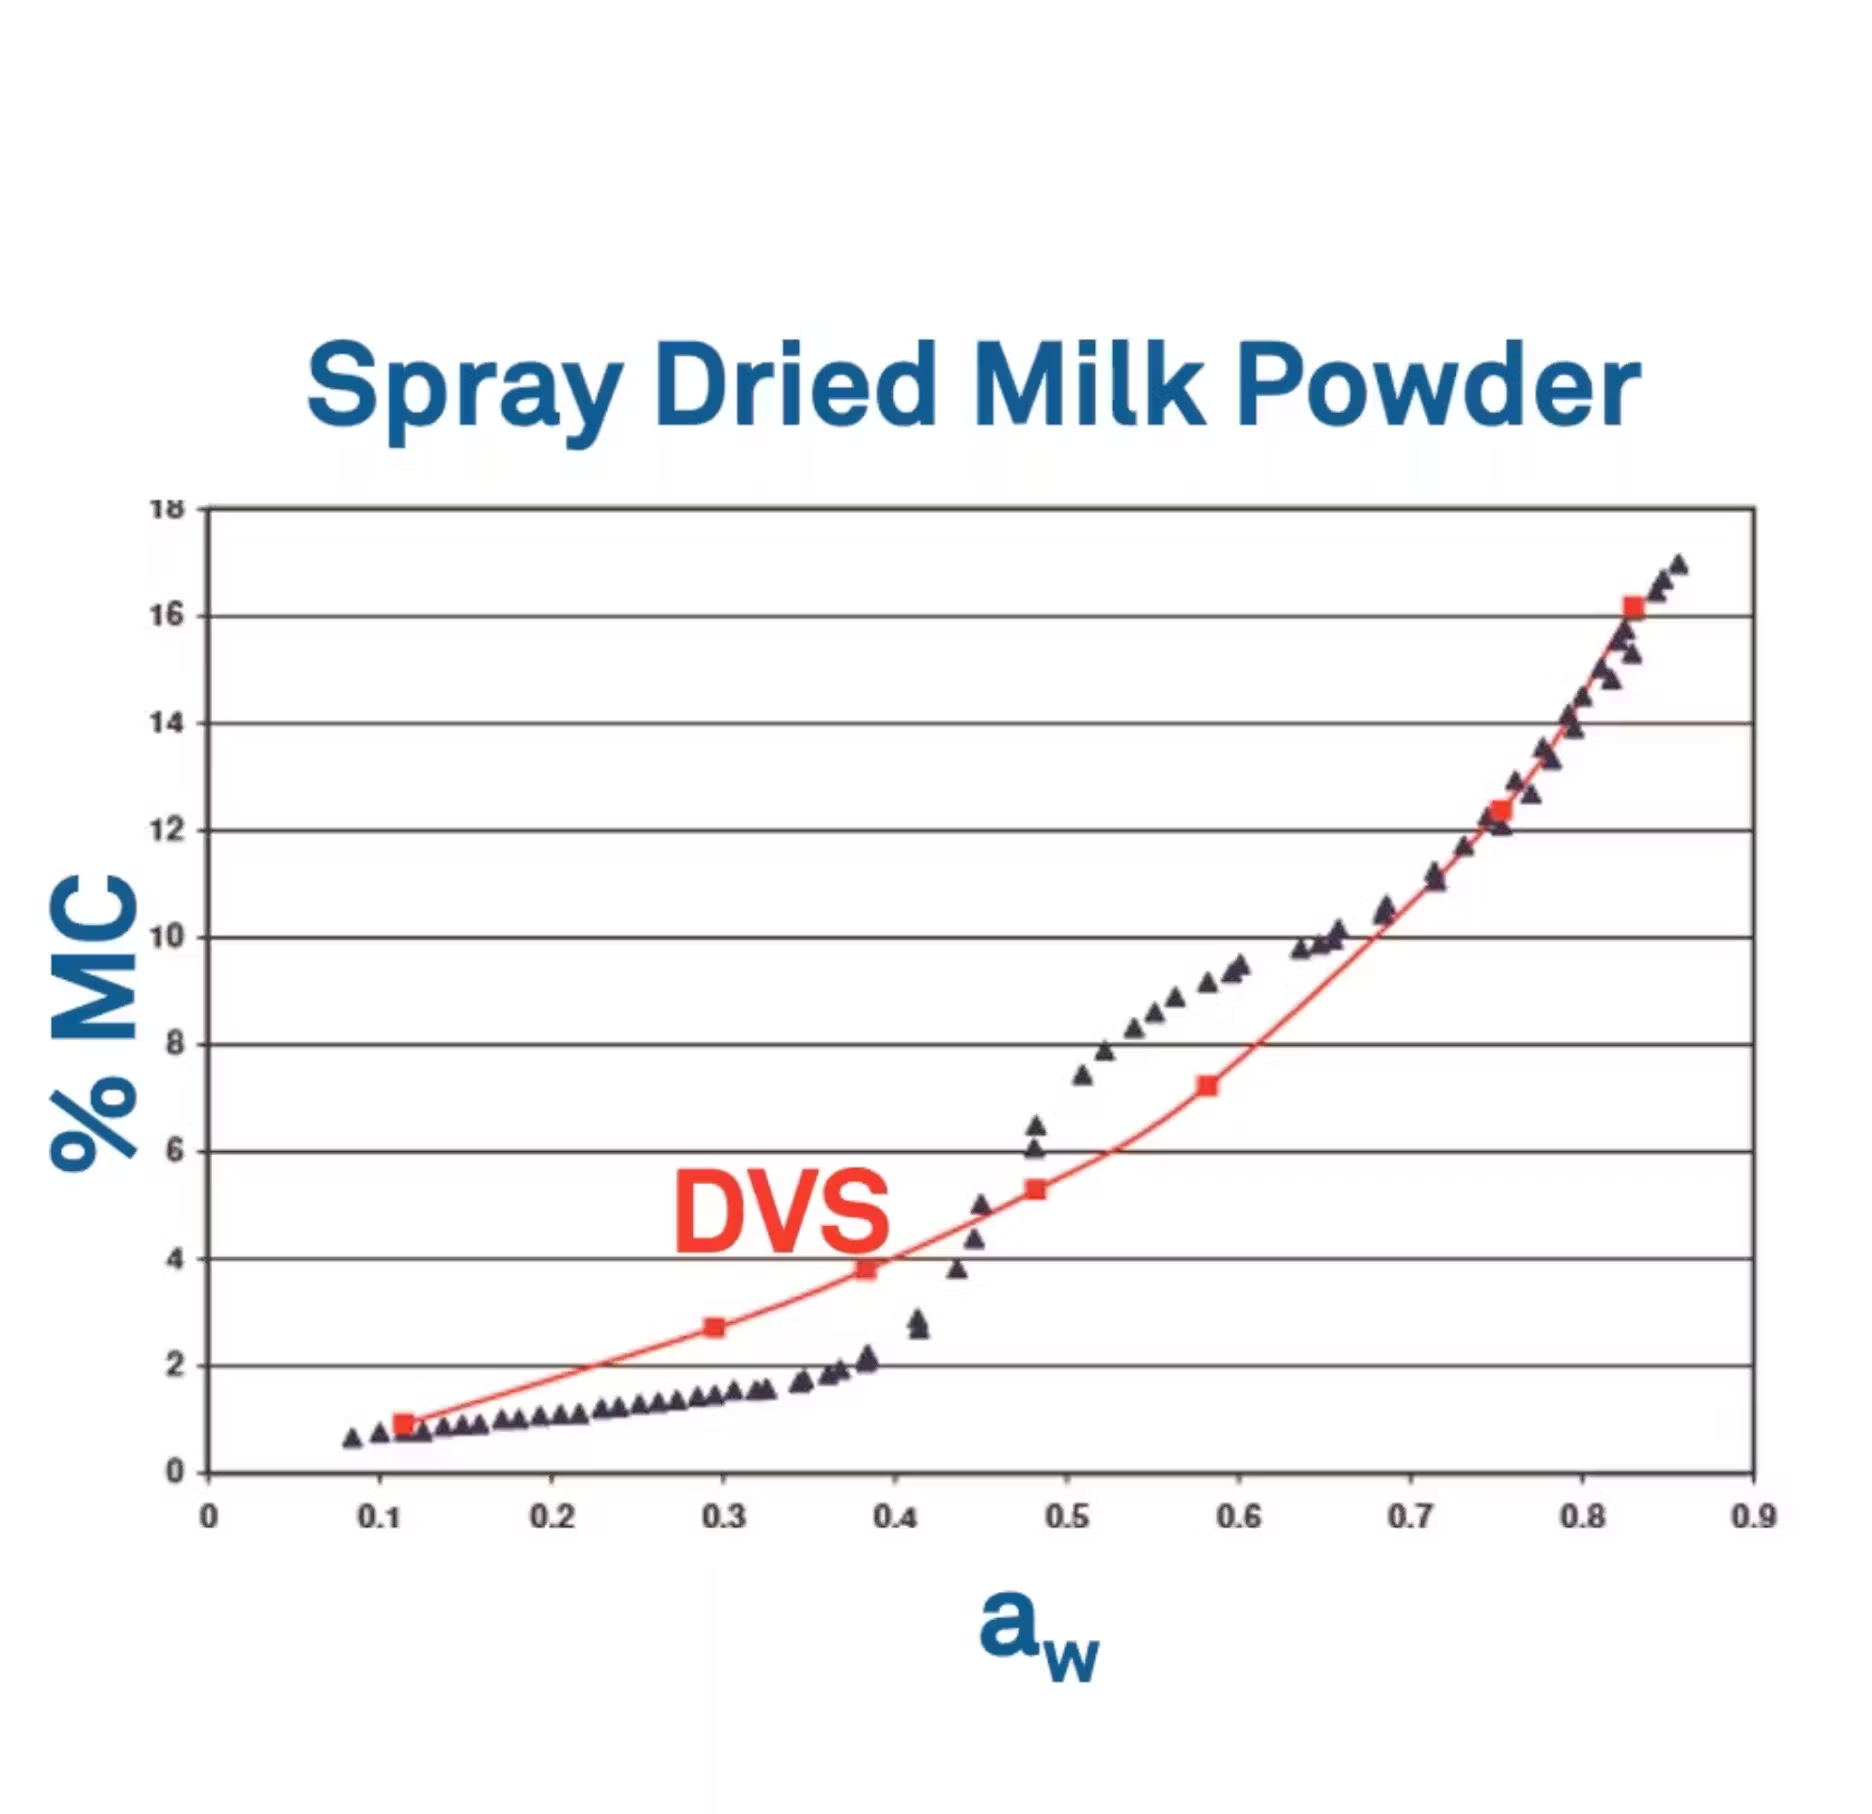
So here's an example of an isotherm that I like to show for spray dried milk powder. I want you to bring your attention to the red curve, the DVS curve.
This DVS curve has about seven points. Again, each of these points has reached equilibrium.
I thought it would be a little bit easier to understand this method if we look at a clip art image to understand how this data is being collected. I want you to imagine that you have a closed chamber. In this case, we're at 25˚ C, but we could look at a range of different temperatures. Now, you're going to put your sample in that closed chamber. This could be a food sample, a pharma sample, a soil sample. And in this case, we're at 0.3 water activity. Then underneath this apparatus is a high precision balance.
When running a DVS test, you might ask a question like how long is it going to take for our sample to reach a certain water activity? So in this case, let's say, how long is it going to take to go from 0.3 water activity to 0.5 water activity?
In order to do this, we are going to add wet air to our system. We could do this either direction, wet air or dry air, but because we have to go up to 0.5, we need to add wet air. This is done by pumping air into the chamber. This is controlled using an algorithm known as a PID. Then we're able to watch the relative humidity by using a capacitance sensor. So we're going to bring the relative humidity in this chamber to 50%.
Now, after an infinite amount of time, that sample is eventually going to come up to 0.5 water activity and come to equilibrium with the surrounding relative humidity.
We know that this test is over by watching the stabilization and the weight. So we're going to wait until that sample has fully equilibrated — there are some different measures or different settings that we can set up to know that we have reached equilibrium.
I want you to keep in mind here that in this instance for DVS, the relative humidity of the chamber is driving the change in water activity. Mary is going to show you a very similar figure for a different method, but this arrow is going to be in the opposite direction.
I also want you to keep in mind for DVS that we're equilibrating by weight, because again, we want to look at sorption kinetics and look at time dependent physical changes. So most pieces of equipment are only equilibrating by weight. We do have a piece of equipment here at METER that equilibrates by weight as well as water activity. I'm sure that Mary will bring that up as well.
Drawbacks to the dynamic vapor sorption (DVS) method
So some drawbacks about this method are as follows:
- Reaching a true equilibrium can require an infinite amount of time. There are some things that you can do to speed up your testing process, but as soon as you do that, that starts to bring into question the validity of the results that you're collecting. The other thing is that most instruments only rely on weight, like I just mentioned. So most instruments are not taking a direct water activity measurement. That means that they're making an assumption that the relative humidity in the chamber is equal to the water activity of the sample, but this is not always the case.
- The second big drawback is that it's impossible to identify phase changes. So if you're looking for a glass transition point or some type of texture transition, it can be almost impossible to do that using either of these two methods that we just went over.
- Finally, the third problem with these methods is they don't really represent real world conditions, because in the real world, conditions are usually much more dynamic and not static. And so you're not really collecting data that represents what's going to happen to your product once it leaves your facility.
Now we're going to talk about a third method now called the dynamic dewpoint isotherm method. Mary's going to go over that for us.
Creating vapor sorption isotherms with the dynamic dewpoint isotherm method
MG: For the DDI method I'm going to use a similar example that Zachary had before. We have our sample at 0.3 water activity in this chamber. There's a high precision measurement balance underneath as well. Right now, it's just sitting there, we're not doing anything to it. So it's going to be driving the humidity inside the chamber. So we're at equilibrium there. So we have 0.3 for the sample and 30% relative humidity in the chamber.
When we're looking at DDI, we're actually asking different questions than we are for the DVS. For example, “how does my sample take up or release moisture in a changing environment?” That's where we get this real world, real time sorption properties that we're evaluating.
So if we want to know what's going to happen to our sample in a dynamic fashion, we're going to start our test here. Similar to what Zachary said before, we're going to put wet air in there. We could also put dry air and dry the sample down, but in our example, we're going to use wet air.
We start the test by pulsing in some humid air. We generally specify a flow rate of that humid air. If we increase the flow rate, that means there's more water available in the atmosphere and the chamber, and the sample can take up more moisture.
If we slow it down, then we are slowing down that process. Generally we slow it down for more hygroscopic samples and speed it up a little bit more for samples that have a big capacity to take on moisture.
We also set a water activity resolution. Normally we do this at a 0.01 water activity. That's how the instrument knows when it needs to be taking a reading.
So we'll start our test here. We're going to wait a while. Like I said, the instrument is going to be assessing the water activity and has that resolution that it's trying to fit. So this could be five minutes to two hours. That's our range of how often it will sample.
So say the time goes by and now we're ready to take a reading. Everything pauses at this point. We no longer are pumping moist air. We let the chamber equilibrate for the sample and the chamber, then take a reading.
We can see that the water activity raised by 0.01. That's what we want, because that's what our resolution is. iIt's also driving the equilibration in the chamber as well — our chamber is also at 31%. We’ll take a weight reading at the same time.
Here, we're going to use a dewpoint sensor, which is an extremely accurate sensor, to take a water activity reading. In this case, it's the sample that drives the chamber equilibration. We're not going to let the weight equilibrate because we want to exaggerate any transitions that are happening. We're going to keep evaluating and we're going to have the moisture available as we're running the test.
When we start opening up the binding sites that Zachary will talk about, then we're going to see a change in the weight of dramatic change that we can use as a transition point. That helps us know what's going to happen in the sample in real time.
I thought it might be good to show a timed graph of how these two data sets would look. This is for microcrystalline cellulose. On the X axis, we're just looking at time. We took a DVS and then a DDI reading because microcrystalline cellulose has a really predictable relationship with water, it takes it up and releases it pretty evenly, so we don't really have transitions to look at. So in that sense, this is a little boring, but it gives a good representation of what the two styles of data look like.
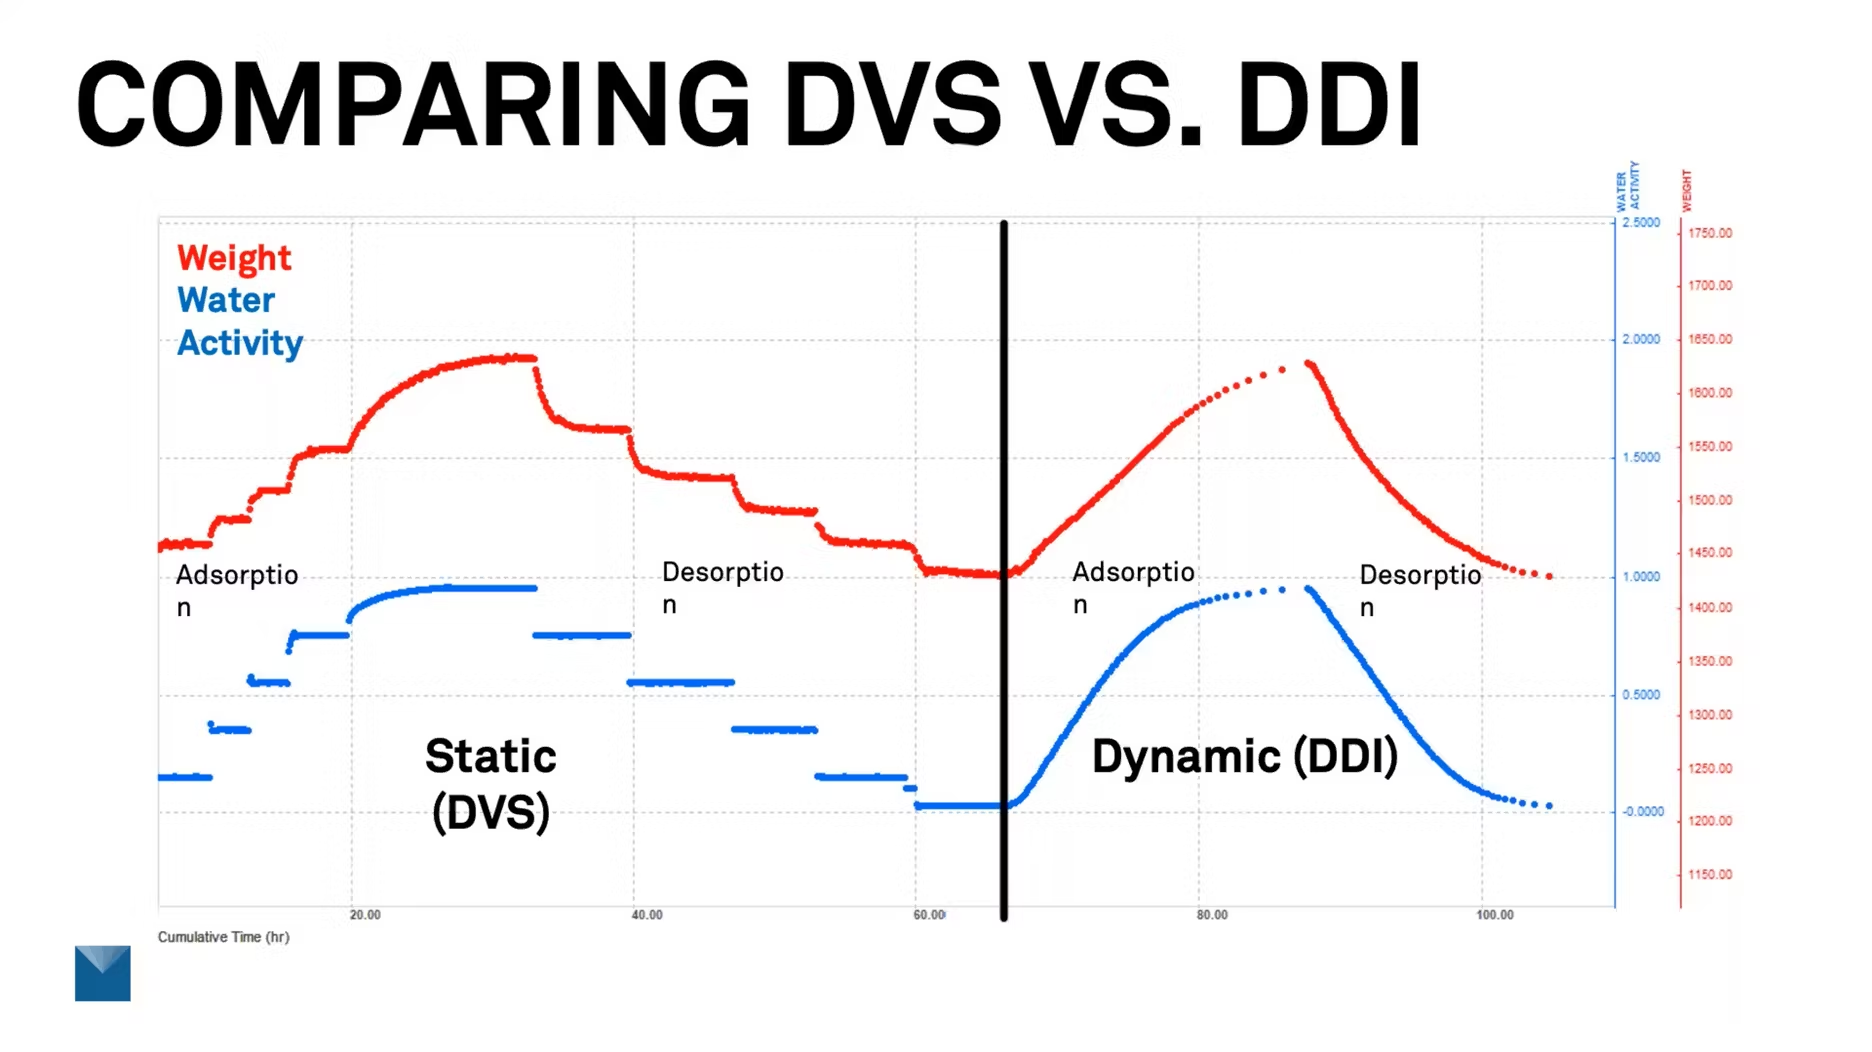
Here, the red traces are the weight. The blue is water activity. In the first section, we have the static DVS. You'll see we have lines that show where we're just holding the humidity and the water activity static, waiting for the weight to equilibrate. Once that happens, we move to the next point. You can see how the weight comes up, flattens out, and then we move to the next section.
It looks like there's a lot of data here, but we're really focusing on those collaboration points. In a DVS isotherm, we really have 10 data points that we're looking at, five for the absorption and five for the desorption.
If we move over to the right, we see the DDI. It looks like a nice smooth curve, but every one of those is a nice data point. So we can see it in real time as it's progressing through the test. DDI, passing desiccated or humidified air over the sample, is a patented technology from METER Group. It also tracks weight gravimetrically, so it measures that and directly measures water activity as well. So we always know both of those values in process for real time sorption characteristics. That helps a lot in many of the applications we talk about.
Here, we’ll get results in days, not weeks or months, we’ll have a lot of data points with a really good resolution of 0.01 — and we can increase that if we want, it just takes a little more time. Normally, 0.01 is what we do.
If we go back to the example that Zachary showed of spray dried milk powder, we see the DVS in the red, but look at the DDI in the dark blue. You'll notice two transition points.
For spray dried milk powder in particular, we have a glass transition that happens right a little past 0.4, and then it actually goes through a crystallization phase. So if we just relied on the DVS, we would be missing those transitions.
Next, Zachary's going to talk about texture change.
Moisture sorption isotherms and product texture changes
ZC: Thank you, Mary.
Talking about this dynamic dewpoint isotherm method leads straight into texture change. As you were pointing out, spray-dried milk powder has a couple of transitions. Let's talk about how we determine where those transitions happen.
For texture change, we need to determine what we call critical water activities. These are water activities that you need to avoid in order to maintain your desired texture. For really dry products, something like a powder, this would be a water activity that you want to stay below to prevent caking and clumping or loss of flow-ability, but it could also be a snack food product where you're trying to prevent staling or loss of crispness or just loss of your desired texture.
We can also talk about higher moisture, higher water activity products like baked goods or even cold press bars—things where you're trying to prevent syneresis or loss of desired texture. It really depends on the product that you're looking at and the direction of water gain or water loss that you're interested in.
Keep in mind here that you do need a high-resolution isotherm—the dynamic dewpoint methodology—in order to pinpoint exactly where these texture transitions are.
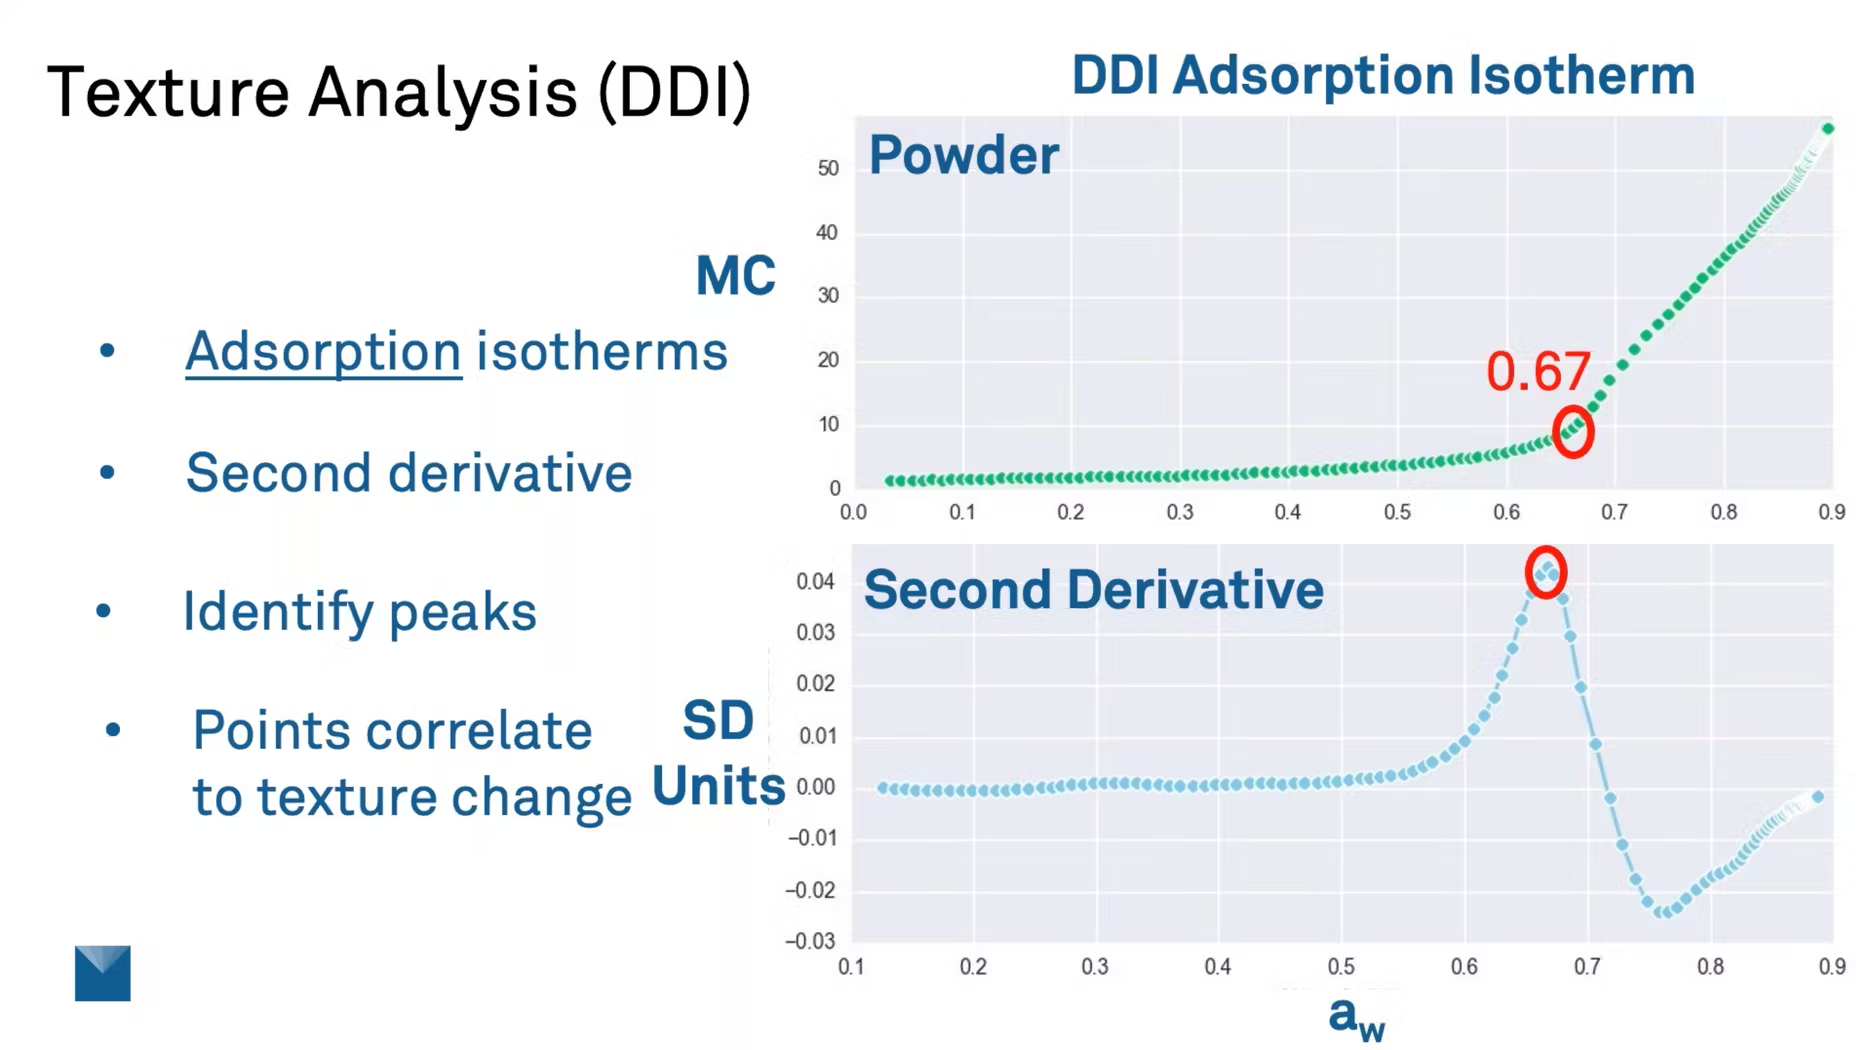
Let me show you exactly why. This is a texture analysis using a dynamic dewpoint isotherm, a sorption isotherm for a powder. The first thing you'll notice about this powder is the shape of that curve.
You'll see that for a very small change in moisture content, maybe a 1% change, you can see maybe a 30 or a 40% change in water activity. A lot of products have this characteristic. This is one key reason it's important to measure water activity—because of the resolution of that measurement.
Now, if we take this isotherm and we look at the second derivative, the second derivative is basically an analysis of the rate of change of the slope of that curve. And what the second derivative allows us to do is identify peaks on that curve. And these peaks correlate to the water activity where the moisture content is changing the fastest.
So if we were to click on that peak or highlight that peak, we can see that it's at 0.67 water activity. So this means for this product, this isotherm was done at 25 degree Celsius. So at 0.67 water activity or 60% relative humidity, this would be the glass transition point for this powder.
Let's take a closer look at this isotherm now. So this next slide is the same exact isotherm. And this producer was making this powder initially at a 0.24 water activity. So way down here at this low water activity, there's a limited number of water binding sites. But once you get up to 0.67, this is where a lot of water can start to bind to the product. And as you move even higher up this isotherm, this is where we'll get severe caking and clumping for this product. So if I was working with this powder producer, I might even encourage them to bring up the water activity of their product, because they can safely increase their water activity and slightly increase their moisture content, but still be well below that textured transition point.
Using sorption isotherms to check how well films and coatings retain or repel moisture
I put in a couple other examples here for texture transitions or things like coatings and films. So this next example are isotherms for blueberries. And here we're looking at desorption curves. So we're trying to understand how these blueberries are holding onto the water.
So if you look to the far right, this curve is for blueberries without any type of film on them. So they have a slightly lower moisture content here at the top. And then you'll notice that they have a critical point of about 0.27 water activity. So this means that once these blueberries are in a relative humidity around 27%, then they're going to have the sudden drop off in the moisture.
Now, if we were to add a film or a coating to these blueberries, you'll notice two things. The first thing is that you have a slightly higher initial moisture content, and now this critical water activity is lower. So it's going to take an even drier environment of about 24% relative humidity before these blueberries start to lose their moisture. So I thought this was a really good example if you're thinking about trying to keep water inside of a product.
Now, we can look at the exact opposite, trying to keep water out of a product. So this is an example or some data that was collected for seeds.
So in blue, you're going to see uncoated seeds where water is able to penetrate into those seeds and you have a higher moisture content at the same water activity compared to seeds that have different coatings. So whether you're trying to keep water in a product or water out, isotherms can be a great method for understanding how effective your coating or your film is working.
Next, we're going to be talking about shelf life and choosing packaging, so I'm going to hand this back over to Mary.
Using vapor sorption isotherms to analyze shelf life and packaging performance
MG: People often ask me how to calculate shelf life.
To do the calculation, you’ll need to take into account the sorption properties of the product, the isotherm in particular, and the storage conditions. We need to know what that product is going to experience. So: temperature, relative humidity, atmospheric pressure, and lastly, the packaging. So for this, we need the surface area, mass of the product in the package, and the very important water vapor transmission rate.
So packaging is what is going to protect your product from outside conditions. So if you have good packaging, it's going to limit the vapor that's able to go through.
So let's get started on how I actually do this calculation. So I start by generating an isotherm. And this is an isotherm for granola. And in particular, I'm interested in the absorption only. So I've made this file of just the absorption. Now, I want to know for my product, for a granola bar, the shelf life is going to be limited on its texture change. This is a crunchy granola bar, and we don't want it to stale or get soft or whatever. So it's going to be texture that's going to be what is going to end our shelf life.
So when we look at this isotherm here, it might be difficult to be able to figure out any of the specific transitions that are happening. So what we use is this Savitzky–Golay second derivative. And basically, it's evaluating the slope change and highlighting those in peaks and valleys in this lower graph in the blue.
Now, I get this question quite a bit too, because you'll notice that there's two peaks. And peaks means that there's an uptake in water. We're increasing the moisture. And I get this question, which one do I choose? There is the smaller one that's around little past 0.4. And then there's a bigger one past 0.7.
The tendency might be to pick the higher one, but really we want to know when it transitions first. The water activity of this granola bar natively is about 0.2. So as we're moving up and increasing water activity, we want to know when it will first hit that transition.
So I want to use the first transition. And the first transition is right there at 0.42 water activity. So that's the one I'm going to be using in my calculations. I'm not going to use the bigger one, because by the time we get there, it's already had a change.
All right. So this is the calculator that we use here at METER. You can see some of the information. We're going to go through a little bit of what I talked about before.
So for my granola bar, it's going to be the humidity I picked, 65% relative humidity. We've got C level atmospheric pressure at a 100 kPa, and my temperature is going to be 25 degrees C. Now, for this is just a little granola bar, so we've got a very small sample, 35 grams. The surface area for that also is quite small, but we're in meter squared. So that all is good.
And then I chose one as my water vapor transmission rate, which is actually a pretty good packaging in grams meter squared per day. And then we're going to start with the initial water activity that I talked about. So where it natively starts is at 0.2. And then the critical shelf life. That's where the water activity once it hits that point, it would end shelf life. Now, I put 0.42 because I want it to be easily tracked. You could see where I was getting that data point. I would agree with Zachary that I probably wouldn't actually put 0.42, because by the time it hits this, it's already starting to transition a little bit. We don't want it to get that close.
So I would recommend dropping this critical water activity down a little bit, maybe to 0.4 or maybe 0.38, something like that, just to make sure that we're not getting close to that transition. But for this example, we're going to keep it at 0.42.
In this isotherm, I've trimmed it. You can see that it doesn't have the higher water activity. I'm going to focus on the area where I'm interested in. So the range of water activity I'm interested in, and I want to make sure I'm modeling really well between where it starts and the point for where it's critical. So I can get a good representation of that data.
So we'll look here. We like to use the DLP, which is a double log polynomial. And we have a really great R squared value here of 0.9996. So it's a really great fit. You can use other modeling equations like the GAB or the BET. There's some limitations to those. But in particular, what we really are caring about is getting a good fit to the data, because that's how it's going to predict it well. So it doesn't really matter what it is as long as it's going to model your data correctly.
Back to where we were. Now, when I put this isotherm in, I'm going to put in the trimmed one. I want to put in the one that's going to have the really good model fit. And then from here, I'm going to calculate the shelf life.
Now, when I do that for this granola bar under these conditions, the shelf life is 151 days. That's about five months. So that's not too bad, but let's say that's not quite where you're hoping for. Maybe you're hoping for this granola that would be a whole year. So how do we figure that out? What can we change? And in this case, it's really easy. What we would change is the water vapor transmission rate. So we can use this to determine what packaging will give us the shelf life we need.
So this is a similar calculation, but now with the same data that we put in before, but now instead of the water vapor transmission rate, we're actually going to put in the shelf life that we're looking to get. We're going to put that same trimmed down isotherm that has the good model fit, push calculate.
And now we know that if we have a water vapor transmission rate in our packaging of 0.42, that it's going to give us this whole year shelf life under these conditions. And that's very similar to what would be like a foil line packaging. So this tracks very nicely.
Next, Zachary is going to talk about the business value for isotherms.
How to maximize moisture content for profit using vapor sorption isotherms
ZC: All right. So this is just the last section here of our webinar today.
There are lots of different ways that you can get business value from isotherms. And we focused a lot today just on texture in shelf life. But I tried to summarize this in three key points, the ways that I see clients using isotherms.
So the first one to add business value is simply to maximize the moisture content for profit. So you can use an isotherm to understand the maximum amount of moisture that your products contain while you maintain your quality and your safety. So while maintaining your ideal texture or preventing certain chemical reactions or reactions from occurring, and also keeping the safety and staying below your microbial limit.
A lot of products are sold based on weight, especially in the food industry. And so the more water you can sell, the higher your revenue.
It's pretty straightforward. Water is the cheapest ingredient in your formulation. So if you're able to increase the amount of water, this can help to increase your revenue.
So here's an example of how you could do that. The first step is to set your guardrails. And what I mean by that is to set your acceptable water activity and moisture content ranges. So this is an example for cannabis. And here we're looking at the desorption curve. And this has an ideal water activity between about 0.56 and 0.63 water activity. And we know this because for this specific product, if you go below that water activity, this represents lost quality. You start to lose terpenes and the quality of that bud is not the same. If you go higher than this water activity, this represents lost safety. So this is a region where you can start to have mold and microbial growth.
So once we've set our ideal water activity range, and if we use the desorption isotherm, then we can relate this back to moisture content. And this is important, because anything less than this ideal moisture content represents lost yield and lost revenue.
So by using this isotherm and by having some knowledge of water activity, we're able to find the sweet spot for optimizing all of these things that we want to consider.
Now, the second step is to reduce variation in production. So once we set that target moisture content using our isotherm, then it's really important to start increasing the monitoring of your product during production. So this can result in three things, reduced variation, an increased moisture content, and also safer products.
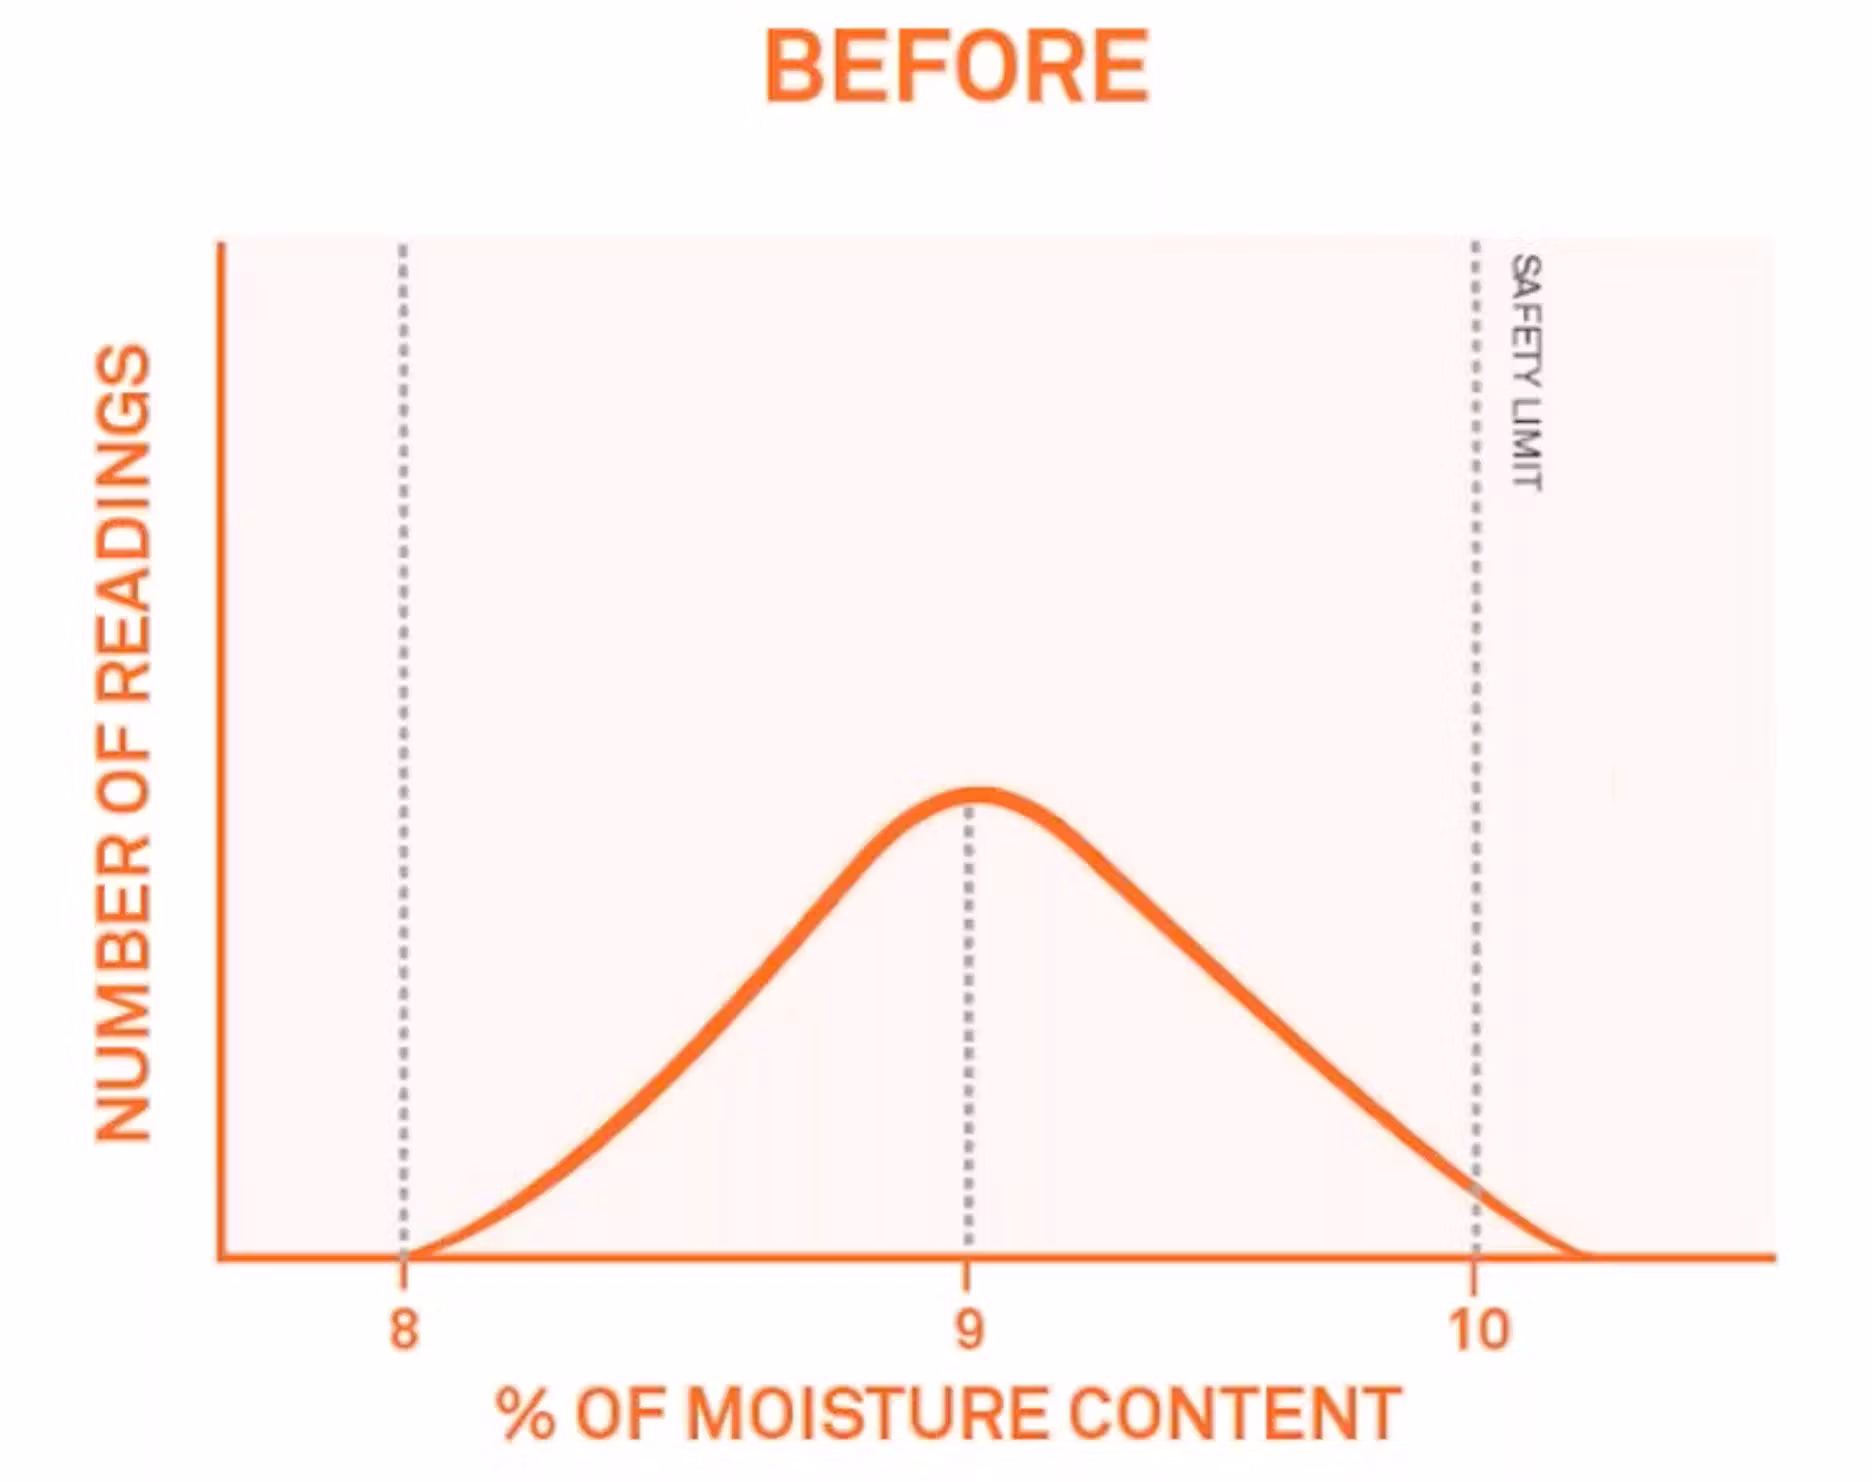
So let me show you exactly what I mean. Here's an example where the average moisture content is right there at 9%. We're looking at about a plus or minus 1% variation. You'll notice that some of the products are going over their safety limit as well as this wide range in production.
Now, if you start to monitor this and increase your moisture content, your results may look like this.
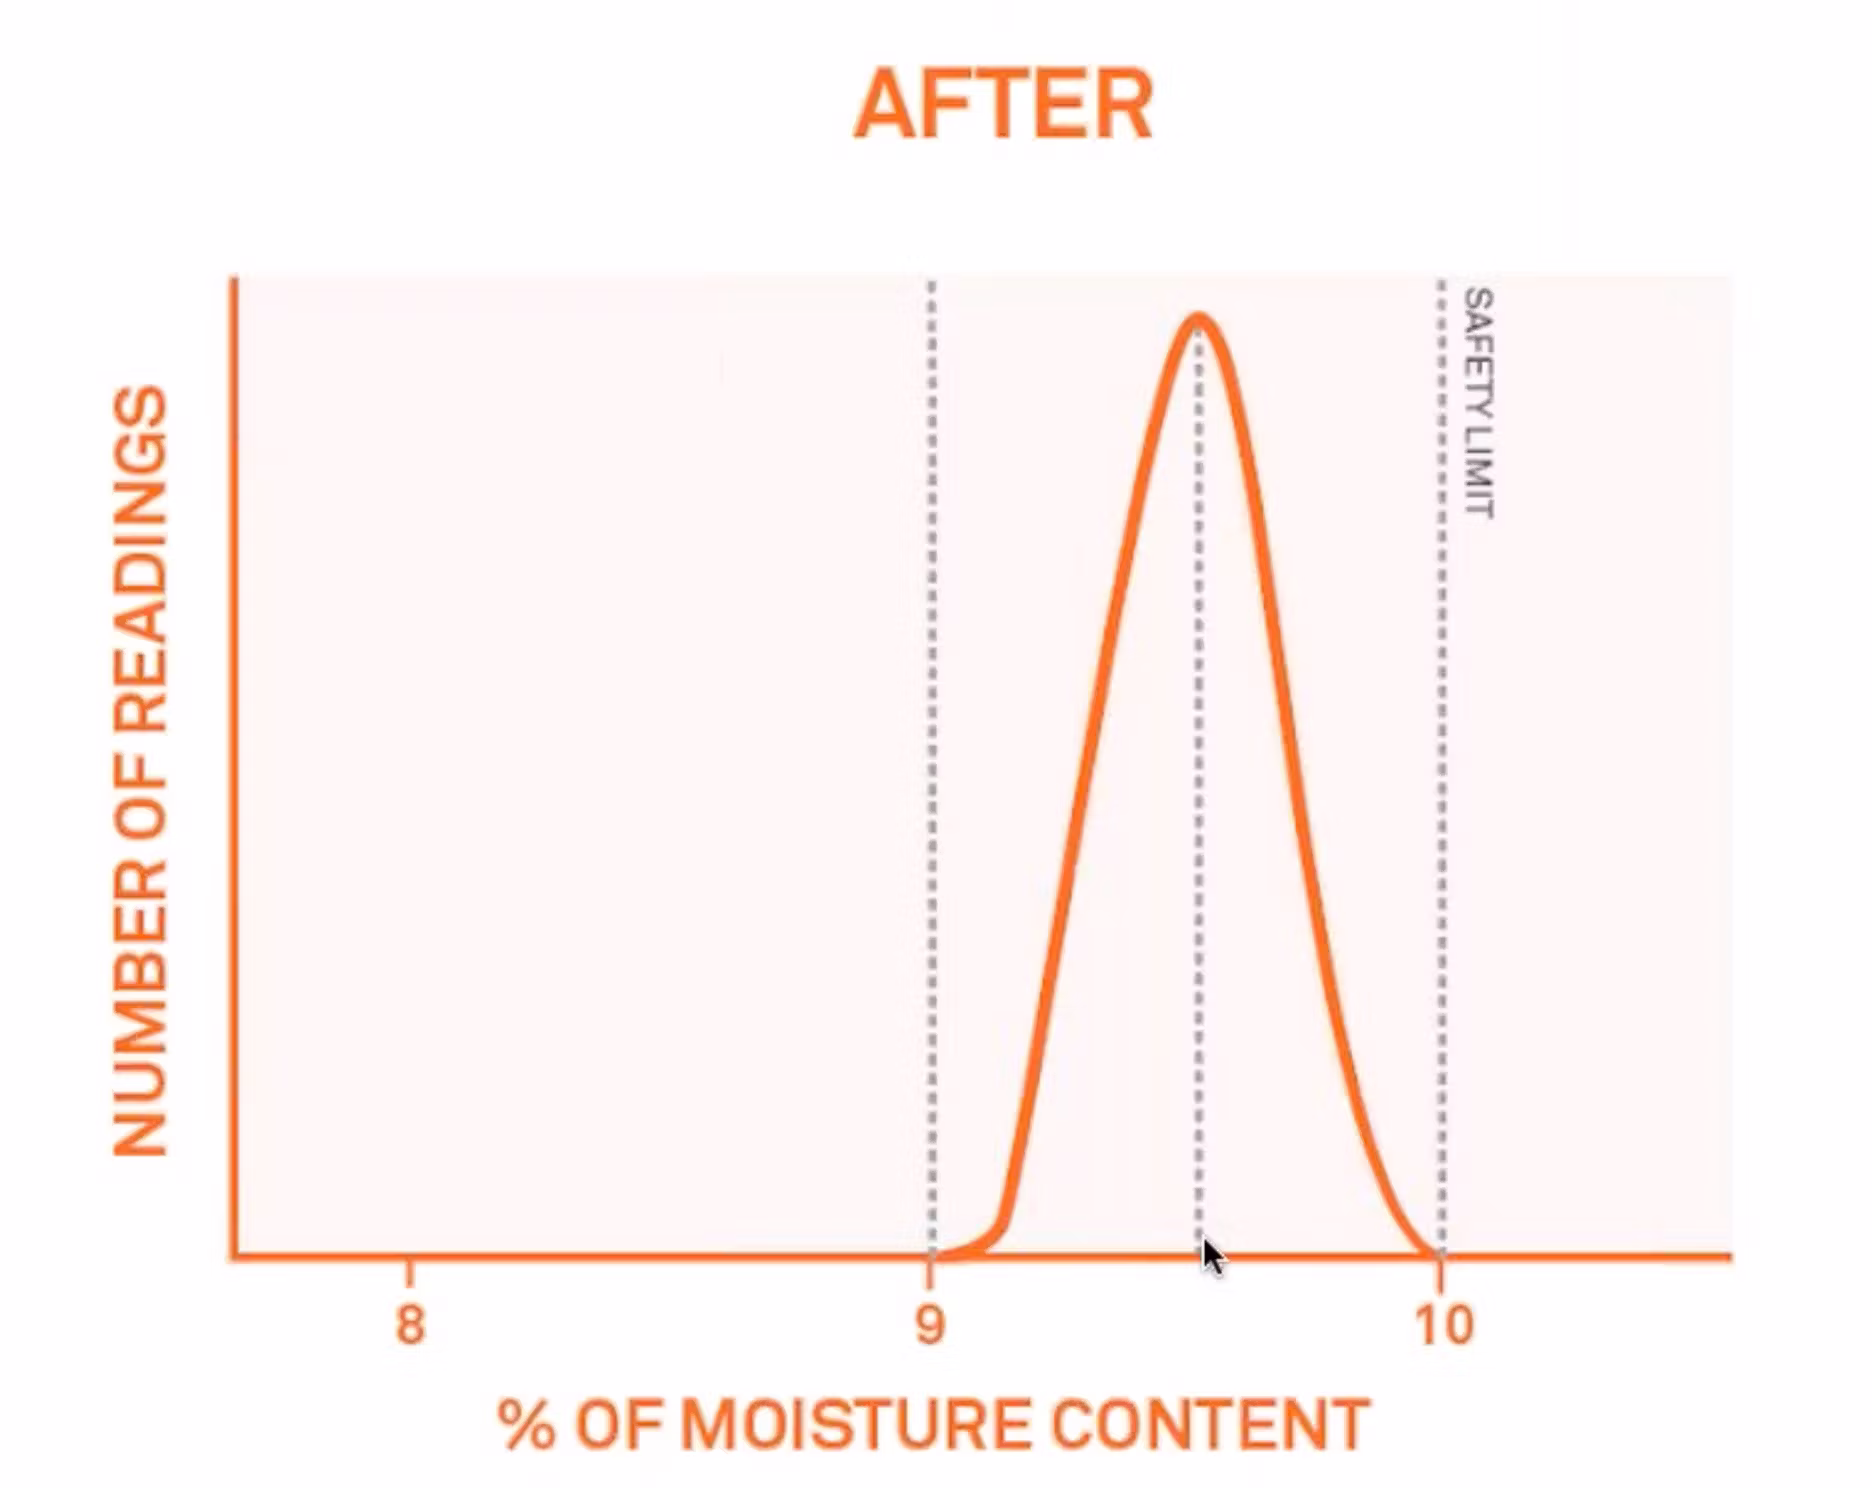
So now you have an average moisture content of 0.95%, a smaller range, maybe plus or minus 0.5% moisture content. And you're also preventing some of your products from going above that safety limit.
So let's look a real world example. This is a business value example for a pet food company here in the states. And it has a really big annual production. And when we first started working with this company, they had a moisture content target right there around 10%.
So by looking at the isotherm and setting a new water activity target, we were able to show this company that they could be producing at 10.4% while maintaining their safety and quality. So just a small change in moisture content.
But let's look at the financial impacts. So here's an example of a graph very similar to the last slide, where you can see the increase in moisture content, the reduced variation. And it doesn't show it as well here, but also preventing products from going above their safety limit.
So because this company was able to start replacing their raw materials now with water, they have a lot of raw material savings, and because they're paying a lot for the raw materials or for the ingredients, after a year, they had about an annual yield increase of over a million dollars for this product or for this formulation.
So I really like this example because it shows how a very small change in moisture content can have a huge impact on the finances for a company.
How to use vapor sorption isotherms to speed up product formulation processes and reduce R&D costs
The second way that isotherms can add business value is by accelerating formulation processes and also reducing R&D costs.
So I'm glad that Mary went back and showed you the modeling, because that modeling can be used to quantify moisture migration of a new product, visualize a new recipe's isotherm and also predict the equilibrium water activity. So all of these things can be done before even making that final product. It just requires that you have an isotherm for each of the ingredients.
So this is an example using the DLP ingredient mixing tool. And in this case, we're going to look at cold press bars.
So imagine that you're making a cold press bar. We're just going to use three ingredients here to keep it simple, but you could add as many ingredients as you want. So here, we're looking at date paste, blueberries and cashews. You just have to put in some information about their water activity, their initial moisture content. And then you can also add a mass. So this allows us to look at different mass ratios.
When you come in here and hit calculate, it's going to show you the isotherms. So here we have the isotherms for the date paste, the blueberries as well as the cashews. And using this information and by modeling this, we can get a combined isotherm. So we can start to understand that final product before we even make it. And we can also get an equilibrium or a final water activity.
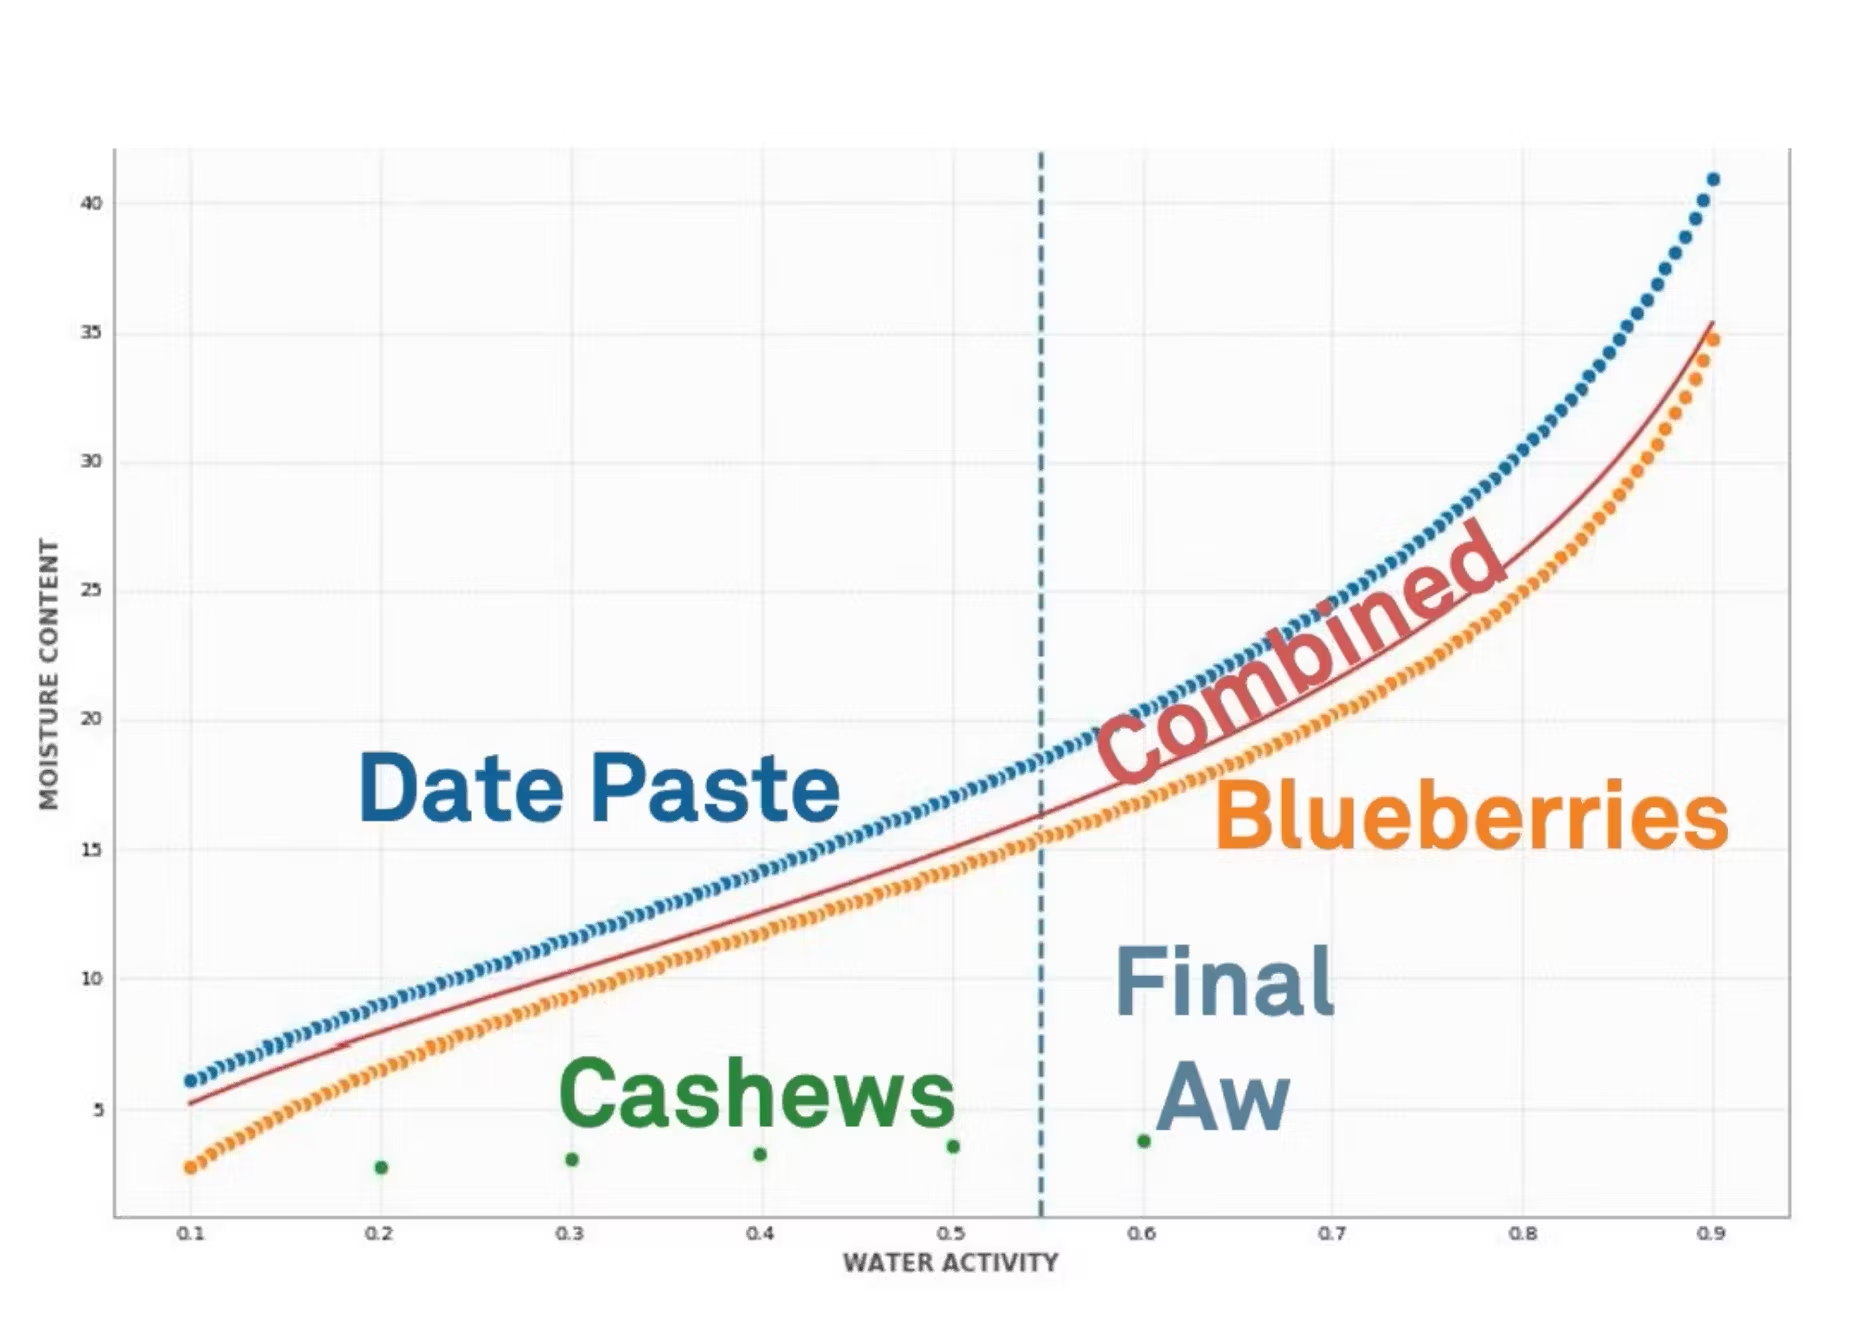
Down below this graph, there's some additional information. You'll see the final water activity again as well as the coefficients for the isotherm. So these coefficients, these were shown on the screen that Mary brought up before for the modeling, but these coefficients can actually be used in the shelf life calculator that Mary was showing so that you can even predict the shelf life and start to think about your packaging needs for a product that hasn't even been made yet.
And then finally, over here to the right, this is just information about the moisture content. So you can understand the direction that water is moving between your ingredients. Here's an example or a narrative from a company using this type of technology.
I hear this all the time from R&D scientists. It's simply taking too long to bring new products to market. And so by using isotherms, you can understand these products much quicker and understand problems that you may run into before they occur. And the business value here is simply being able to release products faster.
So from this specific company, they said that they could release their products about five times faster going from about a five month production time per new product to a one month. And in many cases, this allowed them to be the first to market for new product or new flavors.
How vapor sorption isotherms can prevent product recall and other safety and quality issues
All right. Finally, the third example of bringing some business value to your company using isotherms is simply being able to relax and know that your product is going to be able to maintain its safety and quality once it leaves your facility.
So isotherm analysis allows companies to prevent unwanted texture change, like we've gone over, avoid recalls, especially due to microbial challenges or microbial problems, and also to make those shelf life and packaging decisions again, like we went over before.
So just a quick narrative for each of these.
The first one is for a protein powder company. We see this all the time. A lot of companies really struggle with caking and clumping or loss of flow-ability. In this case, this company was having about five to 10% of their total production having this problem. The result was that they had to either rework this product or get rid of their product. And their reputation was hurt in many instances. The solution here was that they started using isotherms. They understood that they were producing way too close to their glass transition point. And by having this information and by using isotherms to make the correct packaging decisions, they now have less than 0.1% caking. So this issue is costing over $500,000 in lost product the year before, but now really reducing that by having the right type of data and insights.
The next example is for a healthy snack food company. This company was having a recall due to mold complaints by their customers. So we looked at this product and in doing an isotherm analysis, we were able to see a temperature around 35 degrees Celsius was actually causing the water activity to exceed 0.7. So if this company would had used isotherms before, they could have really understood the relationship between water activity and temperature. So now this company is using isotherms to set their product specs and also understand exactly what temperatures they need to avoid. This first recall cost over about 700 and $50,000. And this is something that would be completely preventable if the R&D team would've had these insights ahead of time.
And then the last example is for a packaging company. So this packaging company was working with a client who wanted to use a more environmentally friendly packaging, and they were able to use isotherms to quickly understand the water vapor transmission rate they would need in order to maintain a desired shelf life.
So this is really nice because this company could help their clients switch their packaging with confidence and save them a lot of R&D time and avoid having any issues down the road. So I see this a lot, especially now companies changing packaging, whether it's due to wanting something in more environmentally friendly or having problems getting the packaging that they need and they have to shift to something new.
So we're just going to end here with a summary. And I'll let you go over that, Mary.
Summary and conclusions
MG: Yeah. So hopefully you feel like we've discussed why moisture content and water activity together can give you a lot more information than just one data point if you're just taking a reading of either of those.
Hopefully you now understand the ways you can create an isotherm and can start to think about how to interpret and use them. And surprisingly, even though I know this is really long, a lot of information, Zach and I didn't even go over all the things you can do with isotherm. So check out our website and you can find out more product specific stuff or reach out to us.
We wanted to focus on predicting texture change and doing shelf life predictions, because those are the number one questions that we get.
And hopefully, you've also been able to start thinking about how to extract some business value from the isotherms.
Q&A #1: Can isotherm data be trimmed within METER software, or does one need to use an external program?
MG: No, it's in the software, which is very nice. You don't have to export. You can, but you can do a ton of stuff within the software.
And so to trim your data to figure out those model fits to generate the transition point analysis, all of that's in the software. So it's very nice. You don't have to export it and rework it all in Excel.
Q&A #2: How should an isotherm be created for bread products if there's moisture migration while moisture content remains stable because of good packaging material?
MG: That's a really great question, because there is moisture migration within the product. And eventually that equilibrates out.
But if you're having a problem where that is undesirable after it's packaged and that once it's hit that equilibration, what we can do and what I would suggest to run the isotherm is actually pull those apart and you can run two different isotherms on the crumb and the crust, and then you'll be able to see where the critical points are individually. And you can hopefully be able to formulate.
It'll take a little bit, but you can formulate those to where they end up as equilibrated product that both of those are happy. And you can actually use probably the mixing ingredient example that Zachary had for the bars in this case.
Q&A #3: Do I really need isotherms? We use a trial and error method where we can get a feel for how things are supposed to look, taste, that kind of thing.
ZC: So I think you could save yourself a lot of time if you just start with the isotherm and identify that critical point.
We've done a lot of analysis where once we identify the critical point, let's say for a cocoa powder or something like that, that we also will hold that powder at the relative humidity that will cause that texture change. And then those will have been serve like a sensory panel to see if they can notice a difference. And usually that it lines up perfectly. So we do see a correlation between the sensory panel and then holding the product at that critical point.
So for the most part, what I've seen is there is a correlation. And if you start with the isotherm, I hope that this webinar shows you that using the dynamic method you can pinpoint and exactly know the temperature and the relative humidity that's going to lead to a critical change or a texture change or whatever type of change you're looking at for that product.
So I think you can save yourself a lot of time just by starting with the isotherm. Is there anything you'd add, Mary?
MG: Well, the only thing I would add is we showed that moisture map in the very beginning where it shows how water activity is related to and exacerbating some of the processes that can happen.
So if you know where you're at and know, you can take all of that information to account. You can run the isotherm, get the critical activity. Maybe lipid oxidation is a problem for your powder or a browning issue. And then you can put all of those bits of information together to try to formulate something that's going to have a long stability.
Q&A #4: Any suggestions for hardening of protein bars related to moisture content and water activity, keeping in mind a good shelf life?
ZC: Yeah. So if you're getting hardening of your protein bar, you're probably losing some moisture from that bar. And this may be something that we want to look at with a desorption curve to understand, if you remember that blueberry example, there is a critical point where you start to lose a lot of water from that product.
And it may be similar for this bar where you're just reaching a critical point as you desorb that you need to stay above. So even though lot of what we looked at today was absorption, even in the shelf life calculations that Mary looked at, we can run this in the opposite direction. We can use a desorption curve and then assess different conditions and how that may result in water being removed from your product. So either direction adsorption or desorption, picking up water or losing water, we're able to look at that. We just need to run the right test and collect the right data.
Next steps
See the AQUALAB VSA Complete moisture sorption isotherm analysis
Newsletter signup
Case studies, webinars, and articles you'll love.
Receive the latest content on a regular basis!