What do DVS moisture sorption isotherms say about food stability?
An isotherm is a graph that maps the relationship between moisture content and water activity. Every food manufacturer needs the insights isotherms deliver – here's why.

Isotherms predict product changes over time
Food manufacturers need to know how long it will be before their product molds, gets soggy, goes stale, becomes rancid, cakes, clumps, crystallizes, and becomes unacceptable to the consumer. The moisture sorption isotherm is a powerful tool for predicting and extending the shelf life of a product. It allows you to:
- Find critical water activity values where changes like caking, clumping, and loss of texture occur
- Predict how the product will respond to ingredient and formulation changes
- Accurately estimate shelf life
- Create mixing models
- Perform packaging calculations
- Find the monolayer value (where a product is most stable)
Isotherms: the Holy Grail of formulation
A moisture sorption isotherm is a graph showing how water activity (aw) changes as water is adsorbed into and desorbed from a product held at constant temperature. This relationship is complex and unique for each product. Water activity almost always increases as moisture content increases, but the relationship is not linear. In fact, moisture sorption isotherms are S-shaped (sigmoidal) for most foods and J-shaped for foods that contain crystalline materials or high-fat content.
Handmade method impractical
The classic way to create an isotherm is to put the sample in a desiccator with a salt solution of known water activity until the sample’s weight stops changing. Then, the sample is weighed to determine moisture content. Each sample produces one point on the isotherm curve.
Because the process takes so long, curves were traditionally constructed using five or six data points with curve-fitting equations like GAB or BET.
A faster way to create isotherms
Creating moisture sorption isotherms by hand is painstaking. The method needed automation. The method first used—and still used by most vapor sorption instruments—is called DVS, or dynamic vapor sorption. A sample is exposed to a stream of humidity-controlled air while a microbalance measures tiny changes in weight as the product adsorbs or desorbs water. Once equilibrium is achieved, the instrument dynamically steps to the next preset humidity level. Tests take anywhere from two days to several weeks.
The DVS method works well for investigating the kinetics of sorption—what happens to a product as it is exposed to certain humidities and how fast it adsorbs or desorbs water. The DVS method is not very helpful in creating a high-resolution isotherm curve, however, as each equilibrium step produces just one point on the isotherm curve.
DDI isotherms reveal what hasn’t been seen before
The dynamic dew point isotherm (DDI) method was designed to solve this problem. It creates high-resolution isotherms that show detail in the adsorption and desorption curves by taking a snapshot of both water activity and moisture content (every 5 seconds) as the sample is exposed to humidified or desiccated air. DDI graphs contain hundreds of data points and show details not previously visible, such as critical points where caking, clumping, deliquescence, and loss of texture occur.
Find critical water activity values
Despite double-bagging and issuing strict temperature storage guidelines, a spray-dried milk manufacturer still had problems with clumping.
When glass transition becomes a problem
When milk is spray-dried, rapid evaporation leaves the sugars in a glassy state. Glassy lactose has entirely different properties than crystalline lactose. Due to low mobility, particles don’t cake together or clump up while the powder is in a glassy state. The crystalline structure is a lower energy state, so there will always be some molecules in transition from glassy to crystalline. Problems occur when the rate of transition reaches a tipping point.
Water activity predicts transition rate
At 0.30 aw, it might take several years for the all the lactose to become crystalline. At 0.40 aw, it might take a month. Above 0.43, the transition will occur in a few hours. Once the lactose has crystallized, the powdered milk is permanently changed. It holds a dramatically different amount of water, it won’t dissolve, and it doesn’t taste right. In essence, it has been ruined.
DDI isotherms predict glass transition point
The glass transition point for powders like spray-dried milk can be determined using a high-resolution DDI isotherm. Traditional isotherms rely on models to fill in the isotherm between measured points. DDI isotherms measure hundreds of points and can identify transitions such as the glass transition point for spray-dried milk powder.
The peak value on the second derivative plot of the isotherm identifies the critical phase change value as 0.43 aw.
Routine, accurate testing at the line with better control values helped the manufacturer improve shipment acceptance rate.
Create mixing models
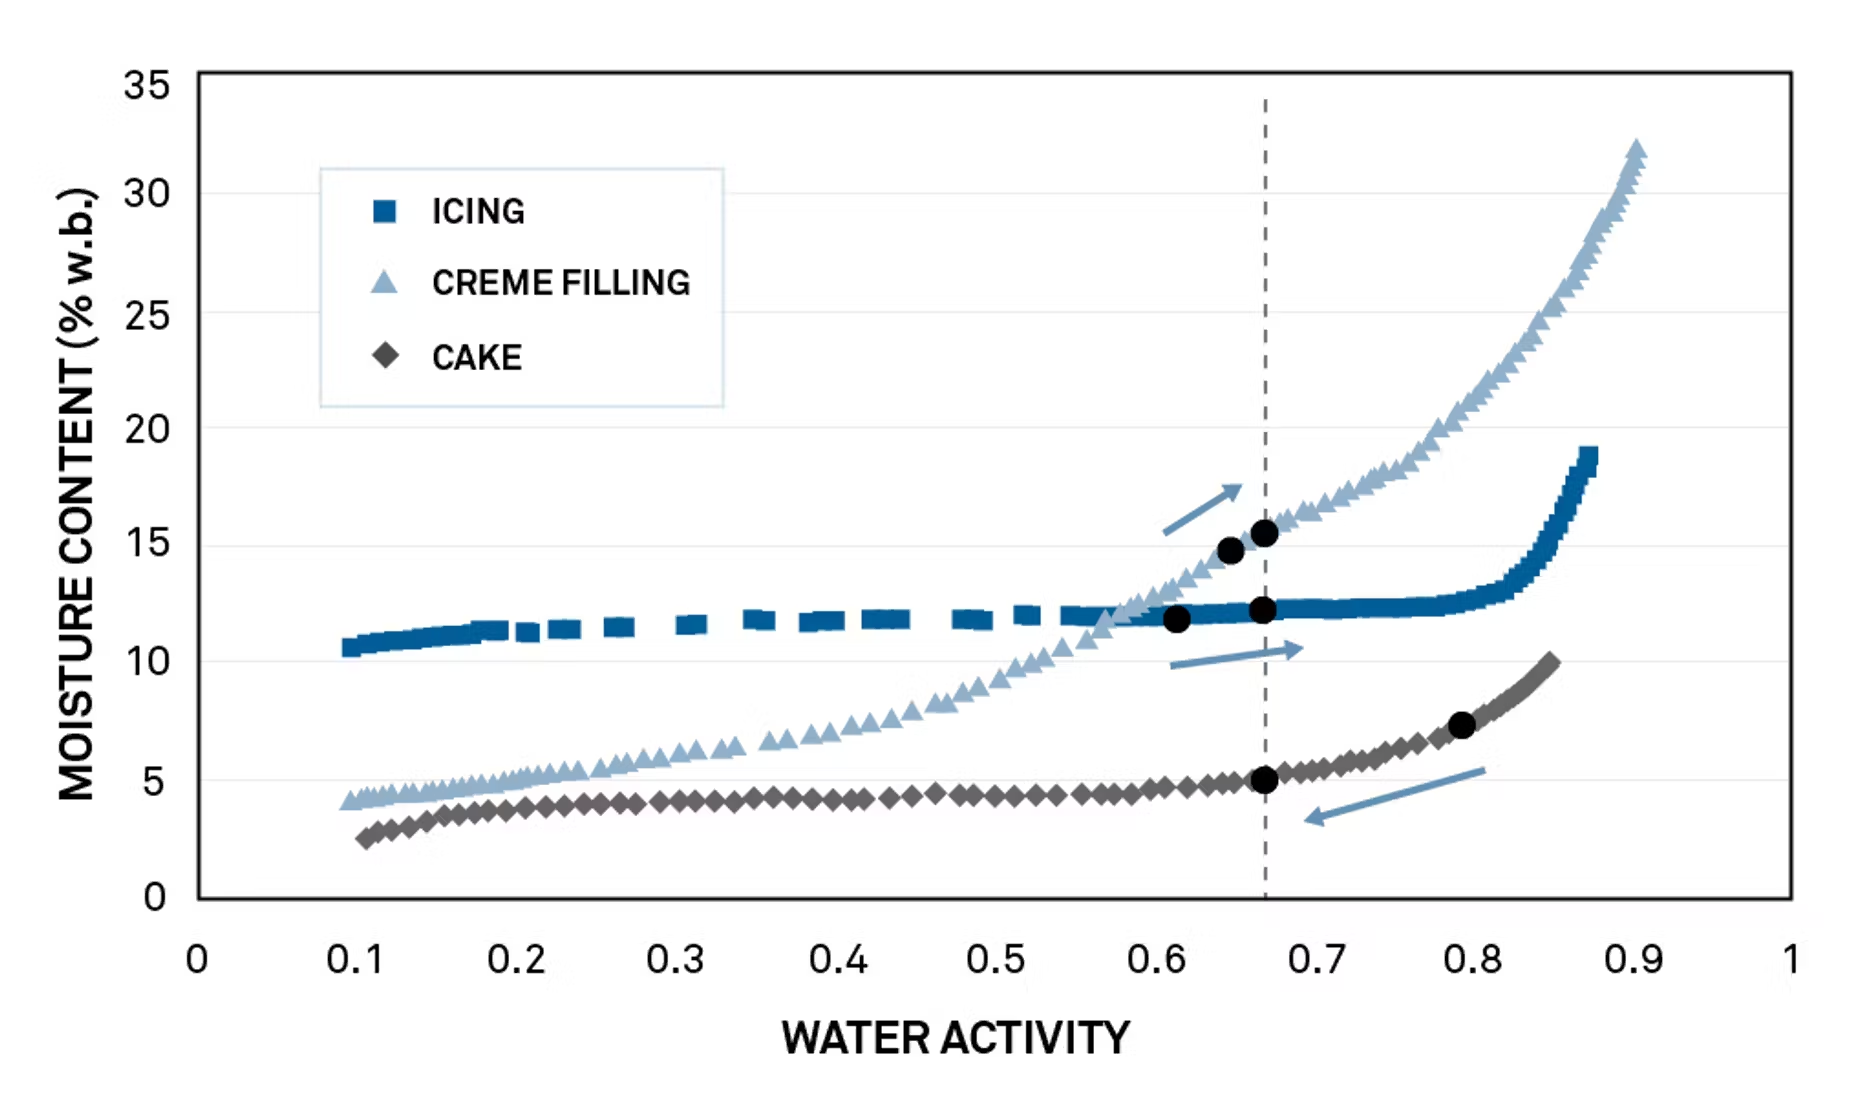
A cake manufacturer was formulating a recipe for cream-filled cake. The components of the recipe were frosting (about 7% moisture), cream filling (12%), and cake (15%). Moisture migration during shelf life had previously caused texture issues such as stale cake, rubbery frosting, and liquefied cream filling bleeding into the cake.
See how moisture will move between components
Moisture sorption isotherms for each ingredient showed that the frosting—the driest ingredient—had the highest water activity at 0.79. Water activities of the cream and the cake were similar—0.66 and 0.61 respectively.
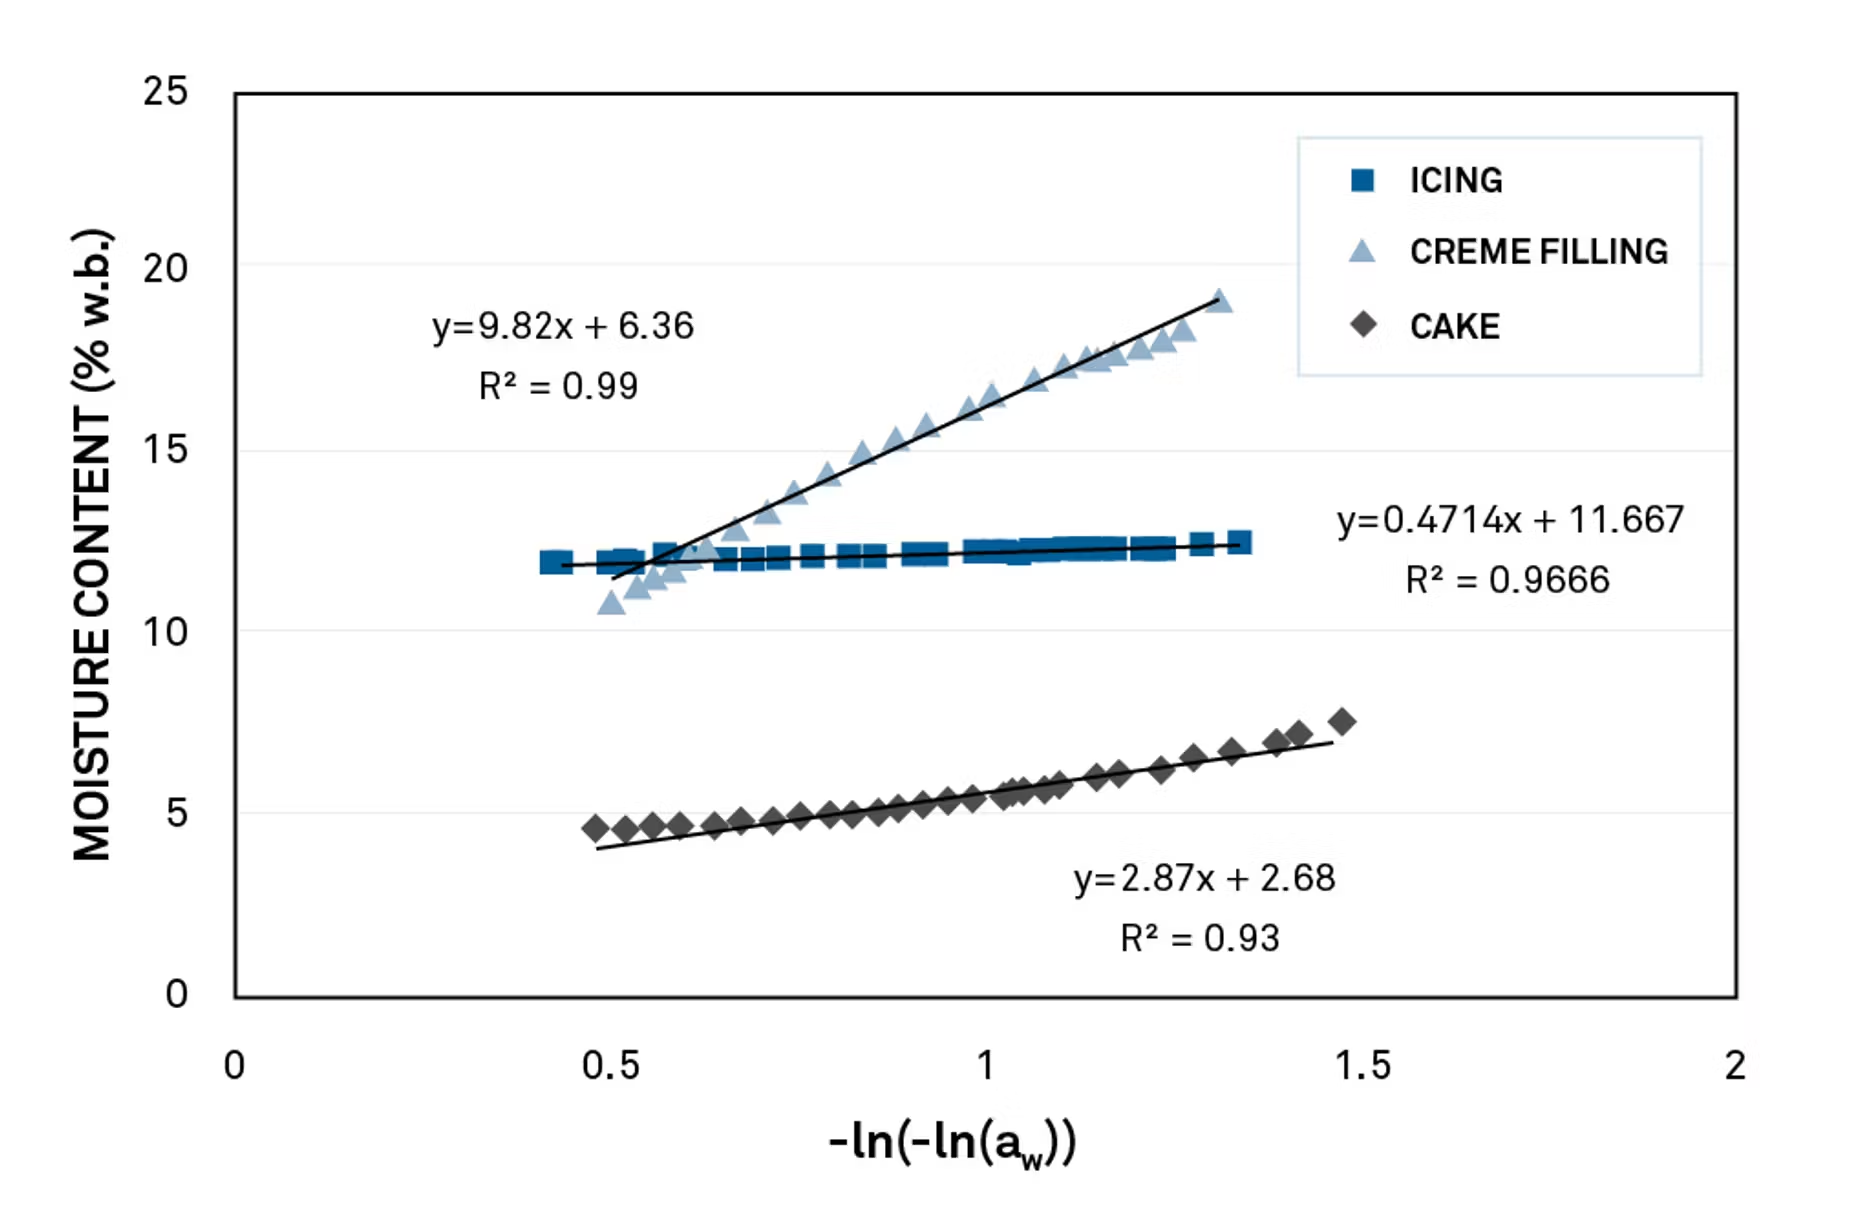
Predict water activity of the final product
Transforming isotherms to chi plots predicted water activity of the final product as 0.67, a microbially safe value for the cake.
Avoid unpleasant surprises
The cake maker went on to successfully bake and taste test the cake at equilibrium water activity (0.67).
Select packaging
Single-serve powdered drink mixes are a growing market segment. Packaging accounts for more than 50% of the raw materials cost for this product. The main goal of the packaging is to maintain the drink mix below the critical aw over the target shelf life of the product.
Packaging calculations begin with a critical water activity value. The ability to get a precise point from dynamic dew point isotherms (DDI) makes this type of packaging calculation possible.
This curve shows the glass transition point for a particular drink formulation:

The critical water activity—the exact inflection point—for this drink mix is 0.618 at 25° C.
Calculate package conductance
Using streamlined packaging calculations (available in Fundamentals of Isotherms and as a software tool), we evaluated four different types of packages for this drink mix—its original package and three possible alternatives. Under humidity abuse conditions (25° C, 75% humidity), here are the results:
Understand formulation changes
A pet food company changed formulation to produce a preservative-free product controlled by water activity. Shortly after introducing the product, they began to see returns due to spoilage.
Initial evaluation showed that spoilage predictions were based on water activity tests made at an unusually low temperature—15º C. Isotherms run at 15° C, 25° C, and 40° C showed that if stored under abuse conditions (as pet food often is), spoilage was likely.

The isotherms offered a complete predictive picture, allowing the customer to solve the problem with a new formulation.
Investigate product failure
After 13 problem-free seasons, a pecan grower had his crop rejected because of mold issues. An isotherm was created to investigate the problem.
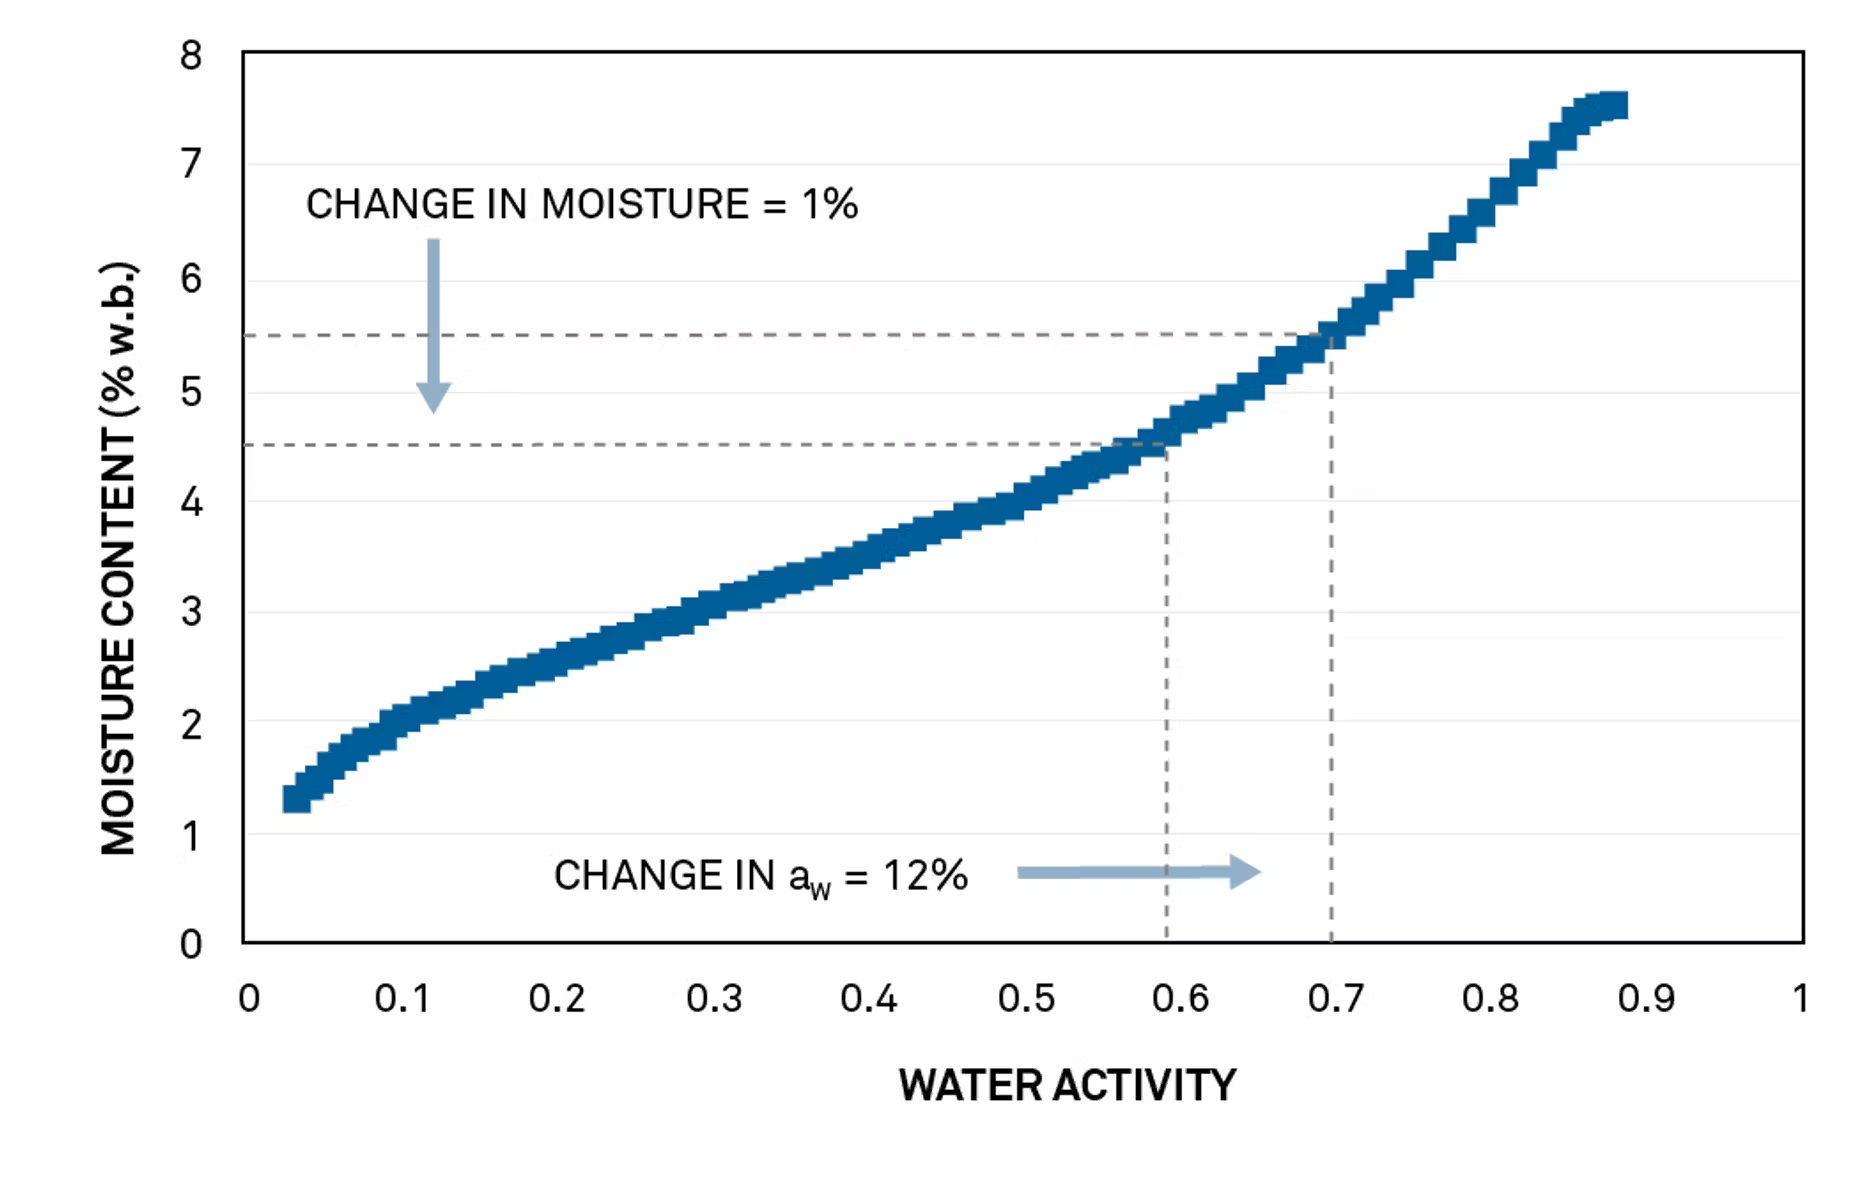
In order to avoid microbial growth, the pecans must be dried to 0.60 aw. As the isotherm shows, 0.60 aw corresponds to 4.8% mc in pecans. The pecan isotherm is also quite flat in this critical control region, so a small variation in moisture content translates into a large and potentially dangerous change in water activity.
Isotherm shows specs were set too low
The full isotherm shows that the pecan grower’s process was not adequate to guarantee the safety and quality of his crop. The pecan grower measured moisture content by loss on drying. Because his release specification was 5% and his accuracy was ± 0.5%, the dried crop’s actual water content could have been anywhere from 4.5% to 5.5%.
Anything from storage at high humidity to inadequate packaging could have pushed the pecans to unsafe water activities and resulted in spoilage.
Learn more about shelf life
In this 30 minute webinar, food scientists Mary Galloway and Zachary Cartwright talk about how to get answers to your shelf life questions. Learn how to:
-Troubleshoot issues and complaints to find out why shelf life is ending sooner than expected
-Predict how recipe changes will impact shelf life
-Compare the effect of different ingredient options
-Evaluate whether a specific packaging option will help you achieve or improve shelf life
Studies using dynamic dew point isotherms (DDI)
Allan, Matthew, and Lisa J. Mauer. “Comparison of methods for determining the deliquescence points of single crystalline ingredients and blends.” Food Chemistry 195 (2016): 29-38. doi:10.1016/j.foodchem.2015.05.042.
Allan, Matthew, Lynne S. Taylor, and Lisa J. Mauer. “Common-ion effects on the deliquescence lowering of crystalline ingredient blends.” Food Chemistry 195 (2016): 2-10. doi:10.1016/j.foodchem.2015.04.063.
Barry, Daniel M., and John W. Bassick. “NASA Space Shuttle Advanced Crew Escape Suit Development.” SAE Technical Paper Series, 1995. doi:10.4271/951545.
Bonner, Ian J., David N. Thompson, Farzaneh Teymouri, Timothy Campbell, Bryan Bals, and Jaya Shankar Tumuluru. “Impact of Sequential Ammonia Fiber Expansion (AFEX) Pretreatment and Pelletization on the Moisture Sorption Properties of Corn Stover.” Drying Technology 33, no. 14 (2015): 1768-778. doi:10.1080/07373937.2015.1039127.
Carter, B.P., Galloway, M.T., Campbell, G.S., and Carter, A.H. 2016. Changes in the moisture permeability of grain at the critical water activity from dynamic dew point isotherms. Transactions of the ASABE. 59(3):1023-1028.
Carter, B.P., Galloway, M.T., Morris, C.F., Weaver, G.L., and Carter, A.H. 2015. The case for water activity as a specification for wheat tempering and flour production. Cereal Foods World 60(4):166-170.
Carter, Brady P., Mary T. Galloway, Gaylon S. Campbell, and Arron H. Carter. “The critical water activity from dynamic dew point isotherms as an indicator of crispness in low moisture cookies.” Journal of Food Measurement and Characterization 9, no. 3 (2015): 463-70. doi:10.1007/s11694-015-9254-3.
Carter, Brady P., Mary T. Galloway, Gaylon S. Campbell, and Arron H. Carter. “The critical water activity from dynamic dew point isotherms as an indicator of pre-mix powder stability.” Journal of Food Measurement and Characterization 9, no. 4 (2015): 479-86. doi:10.1007/s11694-015-9256-1.
Carter, B.P and S.J. Schmidt. 2012. Developments in glass transition determination in foods using moisture sorption isotherms. Food Chemistry 132:1693-1698.
Coronel-Aguilera, Claudia P., and M. Fernanda San Martín-González. “Encapsulation of spray dried β-carotene emulsion by fluidized bed coating technology.” LWT – Food Science and Technology 62, no. 1 (2015): 187-93. doi:10.1016/j.lwt.2014.12.036.
Fonteles, Thatyane Vidal, Ana Karoline Ferreira Leite, Ana Raquel Araújo Silva, Alessandra Pinheiro Góes Carneiro, Emilio De Castro Miguel, Benildo Sousa Cavada, Fabiano André Narciso Fernandes, and Sueli Rodrigues. “Ultrasound processing to enhance drying of cashew apple bagasse puree: Influence on antioxidant properties and in vitro bioaccessibility of bioactive compounds.” Ultrasonics Sonochemistry 31 (2016): 237-49. doi:10.1016/j.ultsonch.2016.01.003.
Hao, Fayi, Lixin Lu, and Jun Wang. “Finite Element Analysis of Moisture Migration of Multicomponent Foods During Storage.” Journal of Food Process Engineering 40, no. 1 (2016). doi:10.1111/jfpe.12319.
Hao, Fayi, Lixin Lu, and Jun Wang. “Finite Element Simulation of Shelf Life Prediction of Moisture-Sensitive Crackers in Permeable Packaging under Different Storage Conditions.” Journal of Food Processing and Preservation 40, no. 1 (2015): 37-47. doi:10.1111/jfpp.12581.
Kuang, Pengqun, Hongchao Zhang, Poonam R. Bajaj, Qipeng Yuan, Juming Tang, Shulin Chen, and Shyam S. Sablani. “Physicochemical Properties and Storage Stability of Lutein Microcapsules Prepared with Maltodextrins and Sucrose by Spray Drying.” Journal of Food Science 80, no. 2 (2015). doi:10.1111/1750-3841.12776.
Liu, Wei, Haifeng Wang, Xifeng Gu, Can Quan, and Xinhua Dai. “Certification of reference materials of sodium tartrate dihydrate and potassium citric monohydrate for water content.” Anal. Methods 8, no. 13 (2016): 2845-851. doi:10.1039/c5ay03067f.
Marquez-Rios, E., V.m. Ocaño-Higuera, A.n. Maeda-Martínez, M.e. Lugo-Sánchez, M.g. Carvallo-Ruiz, and R. Pacheco-Aguilar. “Citric acid as pretreatment in drying of Pacific Lion’s Paw Scallop (Nodipecten subnodosus) meats.” Food Chemistry 112, no. 3 (2009): 599-603. doi:10.1016/j.foodchem.2008.06.015.
Penner, Elizabeth A., and Shelly J. Schmidt. “Comparison between moisture sorption isotherms obtained using the new Vapor Sorption Analyzer and those obtained using the standard saturated salt slurry method.” Journal of Food Measurement and Characterization7, no. 4 (2013): 185-93. doi:10.1007/s11694-013-9154-3.
Rao, Qinchun, Mary Catherine Fisher, Mufan Guo, and Theodore P. Labuza. “Storage Stability of a Commercial Hen Egg Yolk Powder in Dry and Intermediate-Moisture Food Matrices.” Journal of Agricultural and Food Chemistry 61, no. 36 (2013): 8676-686. doi:10.1021/jf402631y.
Rao, Qinchun, Andre Klaassen Kamdar, Mufan Guo, and Theodore P. Labuza. “Effect of bovine casein and its hydrolysates on hardening in protein dough model systems during storage.” Food Control 60 (2016): 621-28. doi:10.1016/j.foodcont.2015.09.007.
Syamaladevi, Roopesh M., Ravi Kiran Tadapaneni, Jie Xu, Rossana Villa-Rojas, Juming Tang, Brady Carter, Shyam Sablani, and Bradley Marks. “Water activity change at elevated temperatures and thermal resistance of Salmonella in all purpose wheat flour and peanut butter.” Food Research International 81 (2016): 163-70. doi:10.1016/j.foodres.2016.01.008.
Wei, Meilin, Xiaoxiang Wang, Jingjing Sun, and Xianying Duan. “A 3D POM–MOF composite based on Ni(ΙΙ) ion and 2,2′-bipyridyl-3,3′-dicarboxylic acid: Crystal structure and proton conductivity.” Journal of Solid State Chemistry 202 (2013): 200-06. doi:10.1016/j.jssc.2013.03.041.
Wei ML, Sun JJ, Wang XJ “Preparation and proton conductivity evaluation of a silicate gel composite doped with a metal–Schiff-base–POM-MOF.”Journal of Sol-Gel Science and Technology 71, no. 2 (2014): 324-28. doi:10.1007/s10971-014-3370-0.
Yuan, X., Carter, B.P. and Schmidt, S.J. 2011. Determining the Critical Relative Humidity at which the Glassy to Rubbery Transition occurs in Polydextrose using an Automatic Water Vapor Sorption Instrument. Journal of Food Science,76(1): E78-89.
Zabalaga, Rosa F., Carla I.a. La Fuente, and Carmen C. Tadini. “Experimental determination of thermophysical properties of unripe banana slices (Musa cavendishii) during convective drying.” Journal of Food Engineering 187 (2016): 62-69. doi:10.1016/j.jfoodeng.2016.04.020.
Newsletter signup
Case studies, webinars, and articles you'll love.
Receive the latest content on a regular basis!